Page 39 - Mocarelli, Luca, and Aleksander Panjek. Eds. 2020. Maize to the People! Cultivation, Consumption and Trade in the North-Eastern Mediterranean (Sixteenth-Nineteenth Century). Koper: University of Primorska Press
P. 39
maize diffusion in the republic of venice: the case of the province of vicenza
prices”. This strengthens the importance of the prices (and of their control)
in defining a product’s level of commercialization (Levi 1991, 156).
Graph 1 shows the price trends of wheat and maize in San Vito be-
tween 1587 and 1708; the trends are fundamentally synchronized, and their
correlation index is 0.67. If we look at the correlation between the two series
in shorter periods, the picture is even more interesting (Table 1).
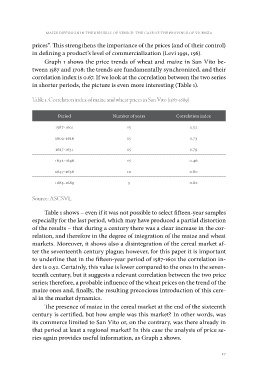
Table 1. Correlation index of maize and wheat prices in San Vito (1587-1689)
Period Number of years Correlation index
1587-1601 15 0.52
1602-1616 15 0.73
1617-1631 15 0.79
1632-1646 15 0.46
1647-1656 10 0.80
1685-1689 5 0.82
Source: ASCSVL
Table 1 shows – even if it was not possible to select fifteen-year samples
especially for the last period, which may have produced a partial distortion
of the results – that during a century there was a clear increase in the cor-
relation, and therefore in the degree of integration of the maize and wheat
markets. Moreover, it shows also a disintegration of the cereal market af-
ter the seventeenth century plague; however, for this paper it is important
to underline that in the fifteen-year period of 1587-1601 the correlation in-
dex is 0.52. Certainly, this value is lower compared to the ones in the seven-
teenth century, but it suggests a relevant correlation between the two price
series; therefore, a probable influence of the wheat prices on the trend of the
maize ones and, finally, the resulting precocious introduction of this cere-
al in the market dynamics.
The presence of maize in the cereal market at the end of the sixteenth
century is certified, but how ample was this market? In other words, was
its commerce limited to San Vito or, on the contrary, was there already in
that period at least a regional market? In this case the analysis of price se-
ries again provides useful information, as Graph 2 shows.
37
prices”. This strengthens the importance of the prices (and of their control)
in defining a product’s level of commercialization (Levi 1991, 156).
Graph 1 shows the price trends of wheat and maize in San Vito be-
tween 1587 and 1708; the trends are fundamentally synchronized, and their
correlation index is 0.67. If we look at the correlation between the two series
in shorter periods, the picture is even more interesting (Table 1).
Table 1. Correlation index of maize and wheat prices in San Vito (1587-1689)
Period Number of years Correlation index
1587-1601 15 0.52
1602-1616 15 0.73
1617-1631 15 0.79
1632-1646 15 0.46
1647-1656 10 0.80
1685-1689 5 0.82
Source: ASCSVL
Table 1 shows – even if it was not possible to select fifteen-year samples
especially for the last period, which may have produced a partial distortion
of the results – that during a century there was a clear increase in the cor-
relation, and therefore in the degree of integration of the maize and wheat
markets. Moreover, it shows also a disintegration of the cereal market af-
ter the seventeenth century plague; however, for this paper it is important
to underline that in the fifteen-year period of 1587-1601 the correlation in-
dex is 0.52. Certainly, this value is lower compared to the ones in the seven-
teenth century, but it suggests a relevant correlation between the two price
series; therefore, a probable influence of the wheat prices on the trend of the
maize ones and, finally, the resulting precocious introduction of this cere-
al in the market dynamics.
The presence of maize in the cereal market at the end of the sixteenth
century is certified, but how ample was this market? In other words, was
its commerce limited to San Vito or, on the contrary, was there already in
that period at least a regional market? In this case the analysis of price se-
ries again provides useful information, as Graph 2 shows.
37