Page 219 - Panjek, Aleksander, Jesper Larsson and Luca Mocarelli, eds. 2017. Integrated Peasant Economy in a Comparative Perspective: Alps, Scandinavia and Beyond. Koper: University of Primorska Press
P. 219
peasant population and income integration: the case of the trieste port-town ...
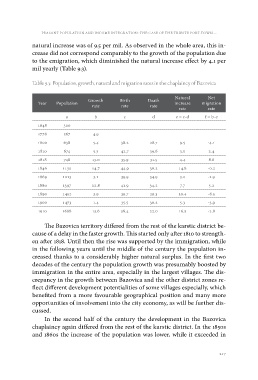
natural increase was of 9.5 per mil. As observed in the whole area, this in-
crease did not correspond comparably to the growth of the population due
to the emigration, which diminished the natural increase effect by 4.1 per
mil yearly (Table 9.3).
Table 9.3: Population, growth, natural and migration rates in the chaplaincy of Bazovica
Year Population Growth Birth Death Natural Net
rate rate rate increase migration
a
300 b c d rate rate
567 e = c-d f = b-e
638 4.9 38.2
1648 674 5.4 42.7 28.7 9.5 -4.1
1778 748 5.5 35.9
1800 1130 13.0 44.9 39.6 3.0 2.4
1810 1213 14.7 39.9
1818 1397 3.1 41.9 31.5 4.4 8.6
1846 1452 12.8 39.7
1869 1473 3.9 35.5 30.2 14.8 -0.2
1880 1688 1.4 38.4
1890 13.6 34.9 5.0 -1.9
1900
1910 34.2 7.7 5.2
29.3 10.4 -6.5
30.2 5.3 -3.9
22.0 16.5 -2.8
The Bazovica territory differed from the rest of the karstic district be-
cause of a delay in the faster growth. This started only after 1810 to strength-
en after 1818. Until then the rise was supported by the immigration, while
in the following years until the middle of the century the population in-
creased thanks to a considerably higher natural surplus. In the first two
decades of the century the population growth was presumably boosted by
immigration in the entire area, especially in the largest villages. The dis-
crepancy in the growth between Bazovica and the other district zones re-
flect different development potentialities of some villages especially, which
benefited from a more favourable geographical position and many more
opportunities of involvement into the city economy, as will be further dis-
cussed.
In the second half of the century the development in the Bazovica
chaplaincy again differed from the rest of the karstic district. In the 1850s
and 1860s the increase of the population was lower, while it exceeded in
217