Page 39 - Fister jr., Iztok, and Andrej Brodnik (eds.). StuCoSReC. Proceedings of the 2017 4th Student Computer Science Research Conference. Koper: University of Primorska Press, 2017
P. 39
Computer configuration 80
The computer used for experimental work had the following
configuration:
Overall performance 60
• System: Windows 10 40
• CPU: Intel Core i7-4790
• RAM: 16 GB
• Programming language: C++
4.3 Results 20 N PMAS =050 25
N PMAS =100
As mentioned in Section 3.3.1, not all combinations of pa- N PMAS =200
rameters NP MAS and N are feasible. Therefore, in the first N PMAS =400
experiment, the following feasible combinations as presented
in Table 1 were used in our study. 0
0 5 10 15 20
Number of agents
Table 1: Feasible combinations of agent’s number N .
NP MAS 1 5 N Figure 1: Comparison of various population sizes
8 10 16 20 25
50 50 10 6.25 5 3.12 2.5 2
100 100 20 12.5 10 6.25 5 4
200 200 40 25 20 12.5 10 8
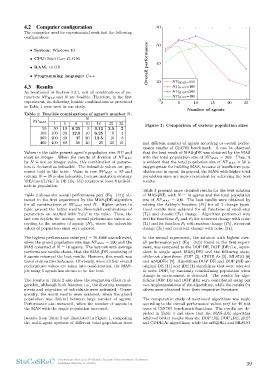
400 400 80 50 40 25 20 16 and different number of agents according to overall perfor-
mance results of CEC’09 benchmark. It can be observed
Values in the table present agent’s population size N P and that the best result of MAS-jDE was obtained by the MAS
must be integer. When the results of division of NP MAS with the total population size of NP MAS = 200. Thus, it
by N is not an integer value, this combination of parame- is evident that the total population size of NP MAS = 50 is
ters is declared as infeasible. The infeasible values are pre- inappropriate for building MAS, because of insufficient pop-
sented bold in the table. Value in row NP MAS = 50 and ulation size in agent. In general, the MASs with higher total
column N = 25 is also infeasible, because mutation strategy population sizes are more convenient for achieving the best
’DE/rand/1/bin’ in DE (Eq. (3)) requires at least 4 individ- results.
uals in population.
Table 3 presents more detailed results for the best solution
Table 2 shows the overall performance perf (Eq. (12)) ob- of MAS-jDE, with N = 10 agents and the total population
tained in the first experiment by the MAS-jDE algorithm size of NP MAS = 200. The best results were obtained by
for all combinations of NP MAS and N . Higher values in solving the Ackley’s function (F5) for all 7 change types.
table present the better results. Non-valid combinations of Good results were achieved for all functions at small-step
parameters are marked with ”n/a” in the table. Thus, the (T1) and chaotic (T4) change. Algorithm performed very
last row depicts the average overall performance values ac- well for functions F2 and F4 for recurrent change with noise
cording to the number of agents (N ), where the infeasible (T6) and for function F6 with random change (T3), recurrent
values of population sizes were ignored. change (T5) and recurrent change with noise (T6).
The highest performance value perf = 70.1968 was achieved, In the second experiment, the solution with highest over-
when the grand population size was NPMAS = 200 and the all performance perf (Eq. (12)) found in the first experi-
MAS consisted of N = 10 agents. The last row with average ment, was compared to the DOP DE, DOP jDE (i.e., equiv-
performance results shows, that the MAS-jDE consisting of alent to single agent MAS-jDE) and the following state-
8 agents returned the best results. However, this result was of-the-art algorithms: jDE* [2], CDDE Ar [5], MLSDO [6]
based only on two instances. Obviously, when all four overall and mSQDE-i [9]. Algorithms DOP DE and DOP jDE are
performance values are taken into consideration, the MAS- original DE [11] and jDE [1] algorithms that were adopted
jde using 5 agents has shown to be the best. to solve DOP, by randomly reinitializing population when
change in environment is detected. The results for algo-
The results in Table 2 also show the stagnation effect in al- rithms DOP DE and DOP jDE were contributed using our
gorithm, although both features, i.e., the diversity measure- own implementations of the algorithms, while the results for
ments and migration of individuals were activated. Conse- others were obtained from their respective literature.
quently, the worst results were achieved, when the grand
population was divided between large number of agents. The comparative study of mentioned algorithms was made
Performance also worsened, when the number of agents in according to the overall performance values perf for 49 test
the MAS with the single population increased. cases of CEC’09 benchmark functions. The results are de-
picted in Table 4 and show that the MAS-jDE algorithm
Results from Table 2 are illustrated in Figure 1, comparing achieved better results than the DOP DE, DOP jDE, jDE*
the multi-agent systems of different total population sizes and CDDE Ar algorithms, while the mSQDE-i and MLSDO
StuCoSReC Proceedings of the 2017 4th Student Computer Science Research Conference 39
Ljubljana, Slovenia, 11 October
The computer used for experimental work had the following
configuration:
Overall performance 60
• System: Windows 10 40
• CPU: Intel Core i7-4790
• RAM: 16 GB
• Programming language: C++
4.3 Results 20 N PMAS =050 25
N PMAS =100
As mentioned in Section 3.3.1, not all combinations of pa- N PMAS =200
rameters NP MAS and N are feasible. Therefore, in the first N PMAS =400
experiment, the following feasible combinations as presented
in Table 1 were used in our study. 0
0 5 10 15 20
Number of agents
Table 1: Feasible combinations of agent’s number N .
NP MAS 1 5 N Figure 1: Comparison of various population sizes
8 10 16 20 25
50 50 10 6.25 5 3.12 2.5 2
100 100 20 12.5 10 6.25 5 4
200 200 40 25 20 12.5 10 8
400 400 80 50 40 25 20 16 and different number of agents according to overall perfor-
mance results of CEC’09 benchmark. It can be observed
Values in the table present agent’s population size N P and that the best result of MAS-jDE was obtained by the MAS
must be integer. When the results of division of NP MAS with the total population size of NP MAS = 200. Thus, it
by N is not an integer value, this combination of parame- is evident that the total population size of NP MAS = 50 is
ters is declared as infeasible. The infeasible values are pre- inappropriate for building MAS, because of insufficient pop-
sented bold in the table. Value in row NP MAS = 50 and ulation size in agent. In general, the MASs with higher total
column N = 25 is also infeasible, because mutation strategy population sizes are more convenient for achieving the best
’DE/rand/1/bin’ in DE (Eq. (3)) requires at least 4 individ- results.
uals in population.
Table 3 presents more detailed results for the best solution
Table 2 shows the overall performance perf (Eq. (12)) ob- of MAS-jDE, with N = 10 agents and the total population
tained in the first experiment by the MAS-jDE algorithm size of NP MAS = 200. The best results were obtained by
for all combinations of NP MAS and N . Higher values in solving the Ackley’s function (F5) for all 7 change types.
table present the better results. Non-valid combinations of Good results were achieved for all functions at small-step
parameters are marked with ”n/a” in the table. Thus, the (T1) and chaotic (T4) change. Algorithm performed very
last row depicts the average overall performance values ac- well for functions F2 and F4 for recurrent change with noise
cording to the number of agents (N ), where the infeasible (T6) and for function F6 with random change (T3), recurrent
values of population sizes were ignored. change (T5) and recurrent change with noise (T6).
The highest performance value perf = 70.1968 was achieved, In the second experiment, the solution with highest over-
when the grand population size was NPMAS = 200 and the all performance perf (Eq. (12)) found in the first experi-
MAS consisted of N = 10 agents. The last row with average ment, was compared to the DOP DE, DOP jDE (i.e., equiv-
performance results shows, that the MAS-jDE consisting of alent to single agent MAS-jDE) and the following state-
8 agents returned the best results. However, this result was of-the-art algorithms: jDE* [2], CDDE Ar [5], MLSDO [6]
based only on two instances. Obviously, when all four overall and mSQDE-i [9]. Algorithms DOP DE and DOP jDE are
performance values are taken into consideration, the MAS- original DE [11] and jDE [1] algorithms that were adopted
jde using 5 agents has shown to be the best. to solve DOP, by randomly reinitializing population when
change in environment is detected. The results for algo-
The results in Table 2 also show the stagnation effect in al- rithms DOP DE and DOP jDE were contributed using our
gorithm, although both features, i.e., the diversity measure- own implementations of the algorithms, while the results for
ments and migration of individuals were activated. Conse- others were obtained from their respective literature.
quently, the worst results were achieved, when the grand
population was divided between large number of agents. The comparative study of mentioned algorithms was made
Performance also worsened, when the number of agents in according to the overall performance values perf for 49 test
the MAS with the single population increased. cases of CEC’09 benchmark functions. The results are de-
picted in Table 4 and show that the MAS-jDE algorithm
Results from Table 2 are illustrated in Figure 1, comparing achieved better results than the DOP DE, DOP jDE, jDE*
the multi-agent systems of different total population sizes and CDDE Ar algorithms, while the mSQDE-i and MLSDO
StuCoSReC Proceedings of the 2017 4th Student Computer Science Research Conference 39
Ljubljana, Slovenia, 11 October