Page 117 - Petelin, Ana, et al. 2019. Eds. Zdravje otrok in mladostnikov / Health of Children and Adolescents. Proceedings. Koper: University of Primorska Press
P. 117
e children spent doing those individual activities, separately for a working digital media use in preschool children and its socio-emotional and health outcomes 115
week and for the weekend.
The purpose of children’s DM use was assessed by parents using a scale
from 1 (never) to 5 (very often) for each of the following activities: playing games
or using apps for entertainment, browsing the internet, watching TV programs,
watching YouTube videos, listening to music, posting photographs, videos or
music, visiting social network sites, communicating with friends and family
using Skype, Viber or WhatsApp, playing educational games (learning letters
of the alphabet, learning numbers, learning foreign language, etc.).
Socio-emotional and health outcomes were assessed by parents using a
scale from 1 (rarely or never) to 5 (almost always) to rate the extent to which
each statement can be applied to their child. There were 11 items, and the Factor
Analysis indicated three subscales: Dissatisfaction (Cronbach’s α=.628), Frus-
tration and attention problem (α=.687), and Social relations (α=.548). There was
an additional item regarding how often the child feels sick.
On a scale form 1 (fully disagree) to 5 (fully agree), parents gave their opin-
ion regarding 24 statements about the positive and negative effects DM has on
their children (adapted from Nikken & Schols, 2015). There were 10 items for
positive and 14 for negative perception. The Cronbach’s α of scales was: 0.820
and 0.793 respectively.
Finally, the SES was assessed by parents rating their financial status on a
scale from 1 (much lower than most families) to 5 (much higher than most fam-
ilies).
Results
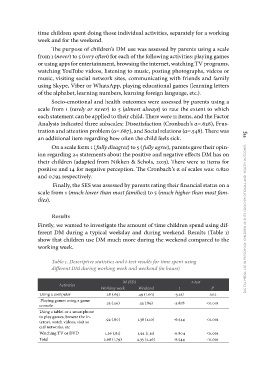
Firstly, we wanted to investigate the amount of time children spend using dif-
ferent DM during a typical weekday and during weekend. Results (Table 1)
show that children use DM much more during the weekend compared to the
working week.
Table 1. Descriptive statistics and t-test results for time spent using
different DM during working week and weekend (in hours)
Activities M (SD) t-test
Using a computer Working week Weekend t P
Playing games using a game .28 (.65) .49 (1.00) -3.217 .002
console
Using a tablet or a smartphone .25 (.50) .53 (.89) -3.878 <0.001
to play games, browse the In-
ternet, watch videos, visit so- .92 (.80) 1.38 (1.10) -6.544 <0.001
cial networks, etc
Watching TV or DVD 1.26 (.81) 1.94 (1.11) -6.804 <0.001
Total 2.68 (1.79) 4.33 (2.46) -8.544 <0.001
week and for the weekend.
The purpose of children’s DM use was assessed by parents using a scale
from 1 (never) to 5 (very often) for each of the following activities: playing games
or using apps for entertainment, browsing the internet, watching TV programs,
watching YouTube videos, listening to music, posting photographs, videos or
music, visiting social network sites, communicating with friends and family
using Skype, Viber or WhatsApp, playing educational games (learning letters
of the alphabet, learning numbers, learning foreign language, etc.).
Socio-emotional and health outcomes were assessed by parents using a
scale from 1 (rarely or never) to 5 (almost always) to rate the extent to which
each statement can be applied to their child. There were 11 items, and the Factor
Analysis indicated three subscales: Dissatisfaction (Cronbach’s α=.628), Frus-
tration and attention problem (α=.687), and Social relations (α=.548). There was
an additional item regarding how often the child feels sick.
On a scale form 1 (fully disagree) to 5 (fully agree), parents gave their opin-
ion regarding 24 statements about the positive and negative effects DM has on
their children (adapted from Nikken & Schols, 2015). There were 10 items for
positive and 14 for negative perception. The Cronbach’s α of scales was: 0.820
and 0.793 respectively.
Finally, the SES was assessed by parents rating their financial status on a
scale from 1 (much lower than most families) to 5 (much higher than most fam-
ilies).
Results
Firstly, we wanted to investigate the amount of time children spend using dif-
ferent DM during a typical weekday and during weekend. Results (Table 1)
show that children use DM much more during the weekend compared to the
working week.
Table 1. Descriptive statistics and t-test results for time spent using
different DM during working week and weekend (in hours)
Activities M (SD) t-test
Using a computer Working week Weekend t P
Playing games using a game .28 (.65) .49 (1.00) -3.217 .002
console
Using a tablet or a smartphone .25 (.50) .53 (.89) -3.878 <0.001
to play games, browse the In-
ternet, watch videos, visit so- .92 (.80) 1.38 (1.10) -6.544 <0.001
cial networks, etc
Watching TV or DVD 1.26 (.81) 1.94 (1.11) -6.804 <0.001
Total 2.68 (1.79) 4.33 (2.46) -8.544 <0.001