Page 39 - Fister jr., Iztok, Andrej Brodnik, Matjaž Krnc and Iztok Fister (eds.). StuCoSReC. Proceedings of the 2019 6th Student Computer Science Research Conference. Koper: University of Primorska Press, 2019
P. 39
ervals of data values for each class. In some cases mean Table 2: The Wilcoxon test showing statistical dif-
values are quite far away form each other. So based on this ferences for qα = 0.05 for all clustering methods used
information, the generated dataset should not be a hard
problem for clustering. KMeans C CM CMP CC
KMeans ∞ ++ + +
C/ ∞∼ + +
Table 1: Time of execution for one function evalua- CM / /∞ + +
tion based on selected optimization function
CMP / // ∞ +
Label Clustering fitness Mean execution Time complexity CC / // / ∞
function
time (worst)
C Eq. (7) 11.8 µs ± 73.3 ns O (NKA)
CM Eq. (8) with penalty 12 µs ± 56.3 ns O KA (N + 1) Eq. (11), since it showed the best performance in our first
set to 0 experiment.
CMP Eq. (8) with penalty 46.3 µs ± 270 ns O KA N + K −1 We measured the performance of algorithms used on three
2 different datasets, which are:
based on Eq. (9)
CC Eq. (8) with penalty 76.9 ms ± 510 µs O NA (2K + 1)
based on Eq. (11)
Mean rank 4.5 • Iris: Dataset has 150 instances with four attributes
4.0 where instances are labeled with three different classes.
3.5 OCptimizatiCoMn functiCoMnPs CC All attributes in the dataset are elements of R+. Each
3.0 class in the dataset has 50 instances.
2.5
2.0 • Breast Cancer Wisconsin (BCW): Dataset has
1.5 569 instances distributed into two classes and each in-
1.0 stance has 30 attributes. All attributes in the dataset
KMeans are elements of R+ numbers set. The first class con-
tains 212 instances, while the second class contains 357
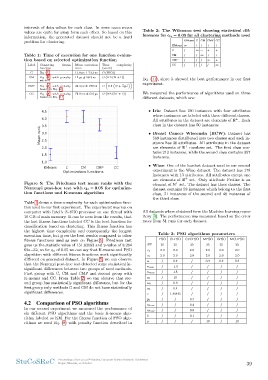
Figure 5: The Friedman test mean ranks with the instances.
Nemenyi post-hoc test with qα = 0.05 for optimiza-
tion functions and K-means algorithm • Wine: One of the hardest dataset used in our second
experiment is the Wine dataset. The dataset has 178
Table 1 shows a time complexity for each optimization func- instances with 13 attributes. All attributes except one
tion used in our first experiment. The experiment was ran on are elements of R+ set. Only attribute Proline is an
computer with Intel’s i5-4570 processor on one thread with element of N+ set. The dataset has three classes. The
16 GB of main memory. It can be seen from the results, that dataset contains 59 instances which belong to the first
the last fitness functions labeled CC is the best function for class, 71 instances of the second and 48 instances of
classification based on clustering. This fitness function has the third class.
the highest time complexity and consequently the longest
execution time, but gives the best results compared to other All datasets where obtained form the Machine learning repos-
fitness functions used as seen on Figure 5. Friedman test itory [3]. The performance was measured based on the error
gave us the statistic value of 151.82682 and p-value of 8.264 rates from 51 runs for each dataset.
69e−32, so for qα of 0.05 we can say that K-means and PSO
algorithm with different fitness functions work significantly Table 3: PSO algorithms parameters
different on generated dataset. In Figure 5, we can observe
that the Nemenyi post-hoc test detected some statistical in- PSO CLPSO OVCPSO MPSO CPSO MCUPSO
significant differences between two groups of used methods.
First group with C, CM and CMP and second group with NP 25 25 25 25 25 25
K-means and CC. From Table 2, we can observe that sec-
ond group has statistically significant difference, but for the c1 2.0 2.0 2.0 2.0 2.0 2.0
first group only methods C and CM do not have statistically
significant differences. c2 2.0 2.0 2.0 2.0 2.0 2.0
4.2 Comparison of PSO algorithms ω / 0.7 / 0.7 0.7 0.7
In our second experiment we measured the performance of vmin / -1.5 / // /
six different PSO algorithms and the basic K-means algo-
rithm labeled as KM. For the fitness function of PSO algo- vmax / 1.5 / // /
rithms we used Eq. (8) with penalty function described in
m / 10 / / / /
ω0 / 0.9 / / / /
ω1 / 0.4 / / / /
c / 1.49445 / // /
p0 / / 0.3 / / /
wmin / / 0.4 / / /
wmax / / 0.9 / / /
δ // 0.1 / / /
µ // / 10 / 10
StuCoSReC Proceedings of the 2019 6th Student Computer Science Research Conference 39
Koper, Slovenia, 10 October
values are quite far away form each other. So based on this ferences for qα = 0.05 for all clustering methods used
information, the generated dataset should not be a hard
problem for clustering. KMeans C CM CMP CC
KMeans ∞ ++ + +
C/ ∞∼ + +
Table 1: Time of execution for one function evalua- CM / /∞ + +
tion based on selected optimization function
CMP / // ∞ +
Label Clustering fitness Mean execution Time complexity CC / // / ∞
function
time (worst)
C Eq. (7) 11.8 µs ± 73.3 ns O (NKA)
CM Eq. (8) with penalty 12 µs ± 56.3 ns O KA (N + 1) Eq. (11), since it showed the best performance in our first
set to 0 experiment.
CMP Eq. (8) with penalty 46.3 µs ± 270 ns O KA N + K −1 We measured the performance of algorithms used on three
2 different datasets, which are:
based on Eq. (9)
CC Eq. (8) with penalty 76.9 ms ± 510 µs O NA (2K + 1)
based on Eq. (11)
Mean rank 4.5 • Iris: Dataset has 150 instances with four attributes
4.0 where instances are labeled with three different classes.
3.5 OCptimizatiCoMn functiCoMnPs CC All attributes in the dataset are elements of R+. Each
3.0 class in the dataset has 50 instances.
2.5
2.0 • Breast Cancer Wisconsin (BCW): Dataset has
1.5 569 instances distributed into two classes and each in-
1.0 stance has 30 attributes. All attributes in the dataset
KMeans are elements of R+ numbers set. The first class con-
tains 212 instances, while the second class contains 357
Figure 5: The Friedman test mean ranks with the instances.
Nemenyi post-hoc test with qα = 0.05 for optimiza-
tion functions and K-means algorithm • Wine: One of the hardest dataset used in our second
experiment is the Wine dataset. The dataset has 178
Table 1 shows a time complexity for each optimization func- instances with 13 attributes. All attributes except one
tion used in our first experiment. The experiment was ran on are elements of R+ set. Only attribute Proline is an
computer with Intel’s i5-4570 processor on one thread with element of N+ set. The dataset has three classes. The
16 GB of main memory. It can be seen from the results, that dataset contains 59 instances which belong to the first
the last fitness functions labeled CC is the best function for class, 71 instances of the second and 48 instances of
classification based on clustering. This fitness function has the third class.
the highest time complexity and consequently the longest
execution time, but gives the best results compared to other All datasets where obtained form the Machine learning repos-
fitness functions used as seen on Figure 5. Friedman test itory [3]. The performance was measured based on the error
gave us the statistic value of 151.82682 and p-value of 8.264 rates from 51 runs for each dataset.
69e−32, so for qα of 0.05 we can say that K-means and PSO
algorithm with different fitness functions work significantly Table 3: PSO algorithms parameters
different on generated dataset. In Figure 5, we can observe
that the Nemenyi post-hoc test detected some statistical in- PSO CLPSO OVCPSO MPSO CPSO MCUPSO
significant differences between two groups of used methods.
First group with C, CM and CMP and second group with NP 25 25 25 25 25 25
K-means and CC. From Table 2, we can observe that sec-
ond group has statistically significant difference, but for the c1 2.0 2.0 2.0 2.0 2.0 2.0
first group only methods C and CM do not have statistically
significant differences. c2 2.0 2.0 2.0 2.0 2.0 2.0
4.2 Comparison of PSO algorithms ω / 0.7 / 0.7 0.7 0.7
In our second experiment we measured the performance of vmin / -1.5 / // /
six different PSO algorithms and the basic K-means algo-
rithm labeled as KM. For the fitness function of PSO algo- vmax / 1.5 / // /
rithms we used Eq. (8) with penalty function described in
m / 10 / / / /
ω0 / 0.9 / / / /
ω1 / 0.4 / / / /
c / 1.49445 / // /
p0 / / 0.3 / / /
wmin / / 0.4 / / /
wmax / / 0.9 / / /
δ // 0.1 / / /
µ // / 10 / 10
StuCoSReC Proceedings of the 2019 6th Student Computer Science Research Conference 39
Koper, Slovenia, 10 October