Page 137 - Petelin, Ana. 2020. Ed. Zdravje delovno aktivne populacije / Health of the Working-Age Population. Proceedings. Koper: University of Primorska Press.
P. 137
Results
Serum zonulin levels
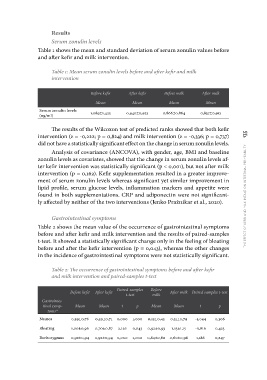
Table 1 shows the mean and standard deviation of serum zonulin values before
and after kefir and milk intervention.
Table 1: Mean serum zonulin levels before and after kefir and milk
intervention
Serum zonulin levels Before kefir After kefir Before milk After milk
(ng/ml) Mean Mean Mean Mean
1,089±1,425 0,940±0,923 0,866±0,864 0,837±0,913
The results of the Wilcoxon test of predicted ranks showed that both kefir the effect of kefir and milk intake on intestinal permeability 135
intervention (z = -0,222; p = 0,824) and milk intervention (z = -0,336; p = 0,737)
did not have a statistically significant effect on the change in serum zonulin levels.
Analysis of covariance (ANCOVA), with gender, age, BMI and baseline
zonulin levels as covariates, showed that the change in serum zonulin levels af-
ter kefir intervention was statistically significant (p < 0,001), but not after milk
intervention (p = 0,162). Kefir supplementation resulted in a greater improve-
ment of serum zonulin levels whereas significant yet similar improvement in
lipid profile, serum glucose levels, inflammation markers and appetite were
found in both supplementations. CRP and adiponectin were not significant-
ly affected by neither of the two interventions (Jenko Pražnikar et al., 2020).
Gastrointestinal symptoms
Table 2 shows the mean value of the occurrence of gastrointestinal symptoms
before and after kefir and milk intervention and the results of paired-samples
t-test. It showed a statistically significant change only in the feeling of bloating
before and after the kefir intervention (p = 0,043), whereas the other changes
in the incidence of gastrointestinal symptoms were not statistically significant.
Table 2: The occurrence of gastrointestinal symptoms before and after kefir
and milk intervention and paired-samples t-test
Before kefir After kefir Paired-samples Before After milk Paired samples t-test
t-test milk
Gastrointes- Mean Mean t p Mean Mean t p
tinal symp-
0,29±0,76 0,29±0,71 0,000 1,000 0,12±0,43 0,31±0,79 -1,044 0,306
toms* 1,00±0,96 0,70±0,87 2,126 0,043 0,92±0,93 1,13±1,15 -0,816 0,423
Nausea 0,92±0,94 0,92±0,94 0,000 1,000 0,84±0,80 0,60±0,96 1,186 0,247
Bloating
Borborygmus
Serum zonulin levels
Table 1 shows the mean and standard deviation of serum zonulin values before
and after kefir and milk intervention.
Table 1: Mean serum zonulin levels before and after kefir and milk
intervention
Serum zonulin levels Before kefir After kefir Before milk After milk
(ng/ml) Mean Mean Mean Mean
1,089±1,425 0,940±0,923 0,866±0,864 0,837±0,913
The results of the Wilcoxon test of predicted ranks showed that both kefir the effect of kefir and milk intake on intestinal permeability 135
intervention (z = -0,222; p = 0,824) and milk intervention (z = -0,336; p = 0,737)
did not have a statistically significant effect on the change in serum zonulin levels.
Analysis of covariance (ANCOVA), with gender, age, BMI and baseline
zonulin levels as covariates, showed that the change in serum zonulin levels af-
ter kefir intervention was statistically significant (p < 0,001), but not after milk
intervention (p = 0,162). Kefir supplementation resulted in a greater improve-
ment of serum zonulin levels whereas significant yet similar improvement in
lipid profile, serum glucose levels, inflammation markers and appetite were
found in both supplementations. CRP and adiponectin were not significant-
ly affected by neither of the two interventions (Jenko Pražnikar et al., 2020).
Gastrointestinal symptoms
Table 2 shows the mean value of the occurrence of gastrointestinal symptoms
before and after kefir and milk intervention and the results of paired-samples
t-test. It showed a statistically significant change only in the feeling of bloating
before and after the kefir intervention (p = 0,043), whereas the other changes
in the incidence of gastrointestinal symptoms were not statistically significant.
Table 2: The occurrence of gastrointestinal symptoms before and after kefir
and milk intervention and paired-samples t-test
Before kefir After kefir Paired-samples Before After milk Paired samples t-test
t-test milk
Gastrointes- Mean Mean t p Mean Mean t p
tinal symp-
0,29±0,76 0,29±0,71 0,000 1,000 0,12±0,43 0,31±0,79 -1,044 0,306
toms* 1,00±0,96 0,70±0,87 2,126 0,043 0,92±0,93 1,13±1,15 -0,816 0,423
Nausea 0,92±0,94 0,92±0,94 0,000 1,000 0,84±0,80 0,60±0,96 1,186 0,247
Bloating
Borborygmus