Page 80 - Petelin, Ana. 2020. Ed. Zdravje delovno aktivne populacije / Health of the Working-Age Population. Proceedings. Koper: University of Primorska Press.
P. 80
Results
We will first present the frequency and intensity of MSD educators in our sam-
ple. Then a set of questions about satisfaction, fatigue, and stress at work as well
as a set about the physical activity of educators. Finally, we will show the con-
nection between them.
The frequency and intensity of MSD among educators
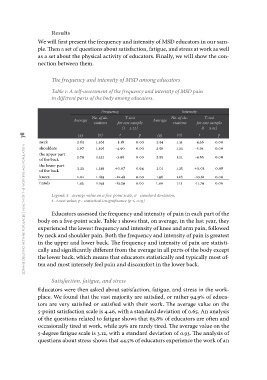
Table 1: A self-assessment of the frequency and intensity of MSD pain
in different parts of the body among educators.
Frequency Intensity
Average No. of de- T-test Average No. of de- T-test
viations for one sample viations for one sample
(x)̄ (x)̄
2.65 (t = 3.22) 2.54 (t = 3.01)
2.67 2.50
zdravje delovno aktivne populacije | health of the working-age population 78 (σ) t p (σ) t p
neck 1.365 -5.18 0.00 1.31 -4.36 0.00
shoulders 1.395 -4.90 0.00
the upper part 1.23 -5.01 0.00
of the back
the lower part 2.79 1.332 -3.98 0.00 2.55 1.21 -4.65 0.00
of the back
knees 3.23 1.219 +0.07 0.94 3.01 1.25 +0.03 0.98
hands
2.02 1.189 -12.48 0.00 1.98 1.18 -10.61 0.00
1.93 1.193 -13.39 0.00 1.90 1.15 -11.79 0.00
Legend: x̄ - average value on a five-point scale, σ - standard deviation,
t - t-test value; p - statistical insignificance (p ≤ 0.05)
Educators assessed the frequency and intensity of pain in each part of the
body on a five-point scale. Table 1 shows that, on average, in the last year, they
experienced the lowest frequency and intensity of knee and arm pain, followed
by neck and shoulder pain. Both the frequency and intensity of pain is greatest
in the upper and lower back. The frequency and intensity of pain are statisti-
cally and significantly different from the average in all parts of the body except
the lower back, which means that educators statistically and typically most of-
ten and most intensely feel pain and discomfort in the lower back.
Satisfaction, fatigue, and stress
Educators were then asked about satisfaction, fatigue, and stress in the work-
place. We found that the vast majority are satisfied, or rather 94.9% of educa-
tors are very satisfied or satisfied with their work. The average value on the
5-point satisfaction scale is 4.46, with a standard deviation of 0.65. An analysis
of the questions related to fatigue shows that 63.8% of educators are often and
occasionally tired at work, while 29% are rarely tired. The average value on the
5-degree fatigue scale is 3.12, with a standard deviation of 0.93. The analysis of
questions about stress shows that 44.5% of educators experience the work of an
We will first present the frequency and intensity of MSD educators in our sam-
ple. Then a set of questions about satisfaction, fatigue, and stress at work as well
as a set about the physical activity of educators. Finally, we will show the con-
nection between them.
The frequency and intensity of MSD among educators
Table 1: A self-assessment of the frequency and intensity of MSD pain
in different parts of the body among educators.
Frequency Intensity
Average No. of de- T-test Average No. of de- T-test
viations for one sample viations for one sample
(x)̄ (x)̄
2.65 (t = 3.22) 2.54 (t = 3.01)
2.67 2.50
zdravje delovno aktivne populacije | health of the working-age population 78 (σ) t p (σ) t p
neck 1.365 -5.18 0.00 1.31 -4.36 0.00
shoulders 1.395 -4.90 0.00
the upper part 1.23 -5.01 0.00
of the back
the lower part 2.79 1.332 -3.98 0.00 2.55 1.21 -4.65 0.00
of the back
knees 3.23 1.219 +0.07 0.94 3.01 1.25 +0.03 0.98
hands
2.02 1.189 -12.48 0.00 1.98 1.18 -10.61 0.00
1.93 1.193 -13.39 0.00 1.90 1.15 -11.79 0.00
Legend: x̄ - average value on a five-point scale, σ - standard deviation,
t - t-test value; p - statistical insignificance (p ≤ 0.05)
Educators assessed the frequency and intensity of pain in each part of the
body on a five-point scale. Table 1 shows that, on average, in the last year, they
experienced the lowest frequency and intensity of knee and arm pain, followed
by neck and shoulder pain. Both the frequency and intensity of pain is greatest
in the upper and lower back. The frequency and intensity of pain are statisti-
cally and significantly different from the average in all parts of the body except
the lower back, which means that educators statistically and typically most of-
ten and most intensely feel pain and discomfort in the lower back.
Satisfaction, fatigue, and stress
Educators were then asked about satisfaction, fatigue, and stress in the work-
place. We found that the vast majority are satisfied, or rather 94.9% of educa-
tors are very satisfied or satisfied with their work. The average value on the
5-point satisfaction scale is 4.46, with a standard deviation of 0.65. An analysis
of the questions related to fatigue shows that 63.8% of educators are often and
occasionally tired at work, while 29% are rarely tired. The average value on the
5-degree fatigue scale is 3.12, with a standard deviation of 0.93. The analysis of
questions about stress shows that 44.5% of educators experience the work of an