Page 107 - Petelin, Ana, Nejc Šarabon, Boštjan Žvanut, eds. 2017. Zdravje delovno aktivne populacije ▪︎ Health of the Working-Age Population. Proceedings. Koper: Založba Univerze na Primorskem/University of Primorska Press
P. 107
ined as showing the presence of a SDS ≥ 2. A moderate perfusion defect was prevalence of silent myocardial ischemia in working-age patients 105
defined as a SDS ≥ 2 in > 1 segment, and severe perfusion defect was defined as
a SDS ≥ 3 in > 1 segment in stress images. Calculation of left ventricular ejection
fraction (LVEF) and ventricular volumes was performed by using quantita-
tive software for endocardial and epicardial boundaries automatically tracing.
Patients with abnormal MPI were referred for coronary angiography. Angio-
graphic images were assessed blindly to the MPI data and significant stenosis
was defined as ≥50% for LAD, and ≥75% for other coronary arteries.
LV dysfunction was defined as post-stress LVEF drop ≥5% and/or tran-
sient ischemic dilatation of LV in stress against rest. The levels of NT-proBNP
were measured at rest and within 3 minutes in the early recovery stage of exer-
cise testing.
All participants gave written informed consent before enrolment in the
study, which was conducted in accord with the principles of the Declaration of
Helsinki. All patients were carefully assessed for classic coronary risk factors:
age, sex, obesity, smoking, essential hypertension, dyslipidaemia, a family his-
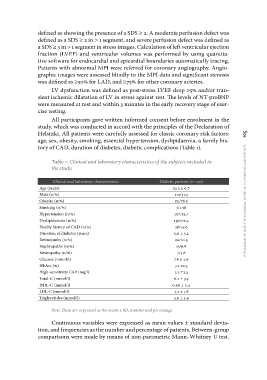
tory of CAD, duration of diabetes, diabetic complications (Table 1).
Table 1: Clinical and laboratory characteristics of the subjects included in
the study.
Clinical and laboratory characteristics Diabetic patients (n=192)
Age (years) 52.3 ± 6.7
Male (n/%) 110/57.3
Obesity (n/%) 151/78.6
Smoking (n/%) 3/1.56
Hypertension (n/%) 107/55.7
Dyslipidaemia (n/%) 140/72.9
Family history of CAD (n/%) 28/14.6
Duration of diabetes (years) 5.0 ± 3.2
Retinopathy (n/%) 20/10.4
Nephropathy (n/%) 13/6.8
Neuropathy (n/%) 7/3.6
Glucose (mmol/l) 7.8 ± 2.6
HbA1c (%) 7.2 ±1.3
High-sensitivity CRP (mg/l) 2.2 ±2.3
Total-C (mmol/l) 6.2 ± 3.5
HDL-C (mmol/l) 0.96 ± 0.4
LDL-C (mmol/l) 4.2 ± 1.8
Triglycerides (mmol/l) 3.9 ± 2.4
Note: Data are expressed as the mean ± SD, number and percentage.
Continuous variables were expressed as mean values ± standard devia-
tion, and frequencies as the number and percentage of patients. Between-group
comparisons were made by means of non-parametric Mann–Whitney U test.
defined as a SDS ≥ 2 in > 1 segment, and severe perfusion defect was defined as
a SDS ≥ 3 in > 1 segment in stress images. Calculation of left ventricular ejection
fraction (LVEF) and ventricular volumes was performed by using quantita-
tive software for endocardial and epicardial boundaries automatically tracing.
Patients with abnormal MPI were referred for coronary angiography. Angio-
graphic images were assessed blindly to the MPI data and significant stenosis
was defined as ≥50% for LAD, and ≥75% for other coronary arteries.
LV dysfunction was defined as post-stress LVEF drop ≥5% and/or tran-
sient ischemic dilatation of LV in stress against rest. The levels of NT-proBNP
were measured at rest and within 3 minutes in the early recovery stage of exer-
cise testing.
All participants gave written informed consent before enrolment in the
study, which was conducted in accord with the principles of the Declaration of
Helsinki. All patients were carefully assessed for classic coronary risk factors:
age, sex, obesity, smoking, essential hypertension, dyslipidaemia, a family his-
tory of CAD, duration of diabetes, diabetic complications (Table 1).
Table 1: Clinical and laboratory characteristics of the subjects included in
the study.
Clinical and laboratory characteristics Diabetic patients (n=192)
Age (years) 52.3 ± 6.7
Male (n/%) 110/57.3
Obesity (n/%) 151/78.6
Smoking (n/%) 3/1.56
Hypertension (n/%) 107/55.7
Dyslipidaemia (n/%) 140/72.9
Family history of CAD (n/%) 28/14.6
Duration of diabetes (years) 5.0 ± 3.2
Retinopathy (n/%) 20/10.4
Nephropathy (n/%) 13/6.8
Neuropathy (n/%) 7/3.6
Glucose (mmol/l) 7.8 ± 2.6
HbA1c (%) 7.2 ±1.3
High-sensitivity CRP (mg/l) 2.2 ±2.3
Total-C (mmol/l) 6.2 ± 3.5
HDL-C (mmol/l) 0.96 ± 0.4
LDL-C (mmol/l) 4.2 ± 1.8
Triglycerides (mmol/l) 3.9 ± 2.4
Note: Data are expressed as the mean ± SD, number and percentage.
Continuous variables were expressed as mean values ± standard devia-
tion, and frequencies as the number and percentage of patients. Between-group
comparisons were made by means of non-parametric Mann–Whitney U test.