Page 108 - Petelin, Ana, Nejc Šarabon, Boštjan Žvanut, eds. 2017. Zdravje delovno aktivne populacije ▪︎ Health of the Working-Age Population. Proceedings. Koper: Založba Univerze na Primorskem/University of Primorska Press
P. 108
Bivariate associations were tested using t test and Fisher’s exact test. To identi-
fy the factors independently related with SMI univariate and multivariate anal-
ysis was performed. P values of <0.05 were considered statistically significant.
Statistical analyses were carried out using IBM SPSS Statistics V.19 software.
Results
MPI results showed that 157 (81,8%) patients had normal myocardial perfusion,
while 35 (18.2%) patients showed perfusion defects on MPI (Table 2). In 33(17.2%)
cases it was defined as reversible and in 2(1.0%) as mixed.
Table 2: MPI results.
Result MPI (n=192)
157/81.8
zdravje delovno aktivne populacije | health of the working-age population 106 Negative (n/%) 35/18.2
Positive (n/%)
Note: Data are expressed as number and percentage.
12 (33.4%) out of the 33 reversible perfusion defects were described as
mild, 14 (42.4%) – moderate, and 7 (22.2%) – severe.
31 (88.6%) patients out of the 35 with abnormal MPI findings represent-
ed an abnormal coronary angiography. In 15(48.4%) out of the 31 patients it was
defined as 1 vessel disease, in 10 (32.3%) – 2 vessels disease and in 6 (19.3%) – 3
vessels disease. 9 (29.0%) patients with positive angiographic results represent-
ed diffuse disease and vessel occlusion was detected in 2 (6.5%). Coronary anat-
omy did not allow any revascularisation procedure in 13 (41.9%) of the patients
with abnormal coronary angiography.
These results emphasize the incremental diagnostic value of MPI for eval-
uation of SMI in this specific subgroup of the diabetic population. MPI have
showed a very good degree of specificity of the test (97.6%) with a positive pre-
dictive value of 88.9% for predicting angiographic coronary stenosis (Table3).
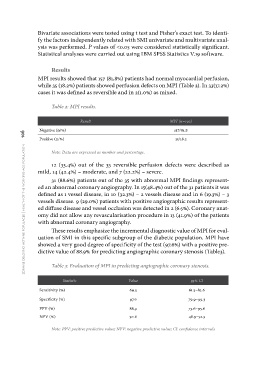
Table 3: Evaluation of MPI in predicting angiographic coronary stenosis.
Statistic Value 95% CI
Sensitivity (%) 69.5 61.5–82.6
Specificity (%) 97.6 79.9–99.3
PPV (%) 88.9 73.6–95.6
NPV (%) 50.6 48.9–52.3
Note: PPV: positive predictive value; NPV: negative predictive value; CI: confidence intervals
fy the factors independently related with SMI univariate and multivariate anal-
ysis was performed. P values of <0.05 were considered statistically significant.
Statistical analyses were carried out using IBM SPSS Statistics V.19 software.
Results
MPI results showed that 157 (81,8%) patients had normal myocardial perfusion,
while 35 (18.2%) patients showed perfusion defects on MPI (Table 2). In 33(17.2%)
cases it was defined as reversible and in 2(1.0%) as mixed.
Table 2: MPI results.
Result MPI (n=192)
157/81.8
zdravje delovno aktivne populacije | health of the working-age population 106 Negative (n/%) 35/18.2
Positive (n/%)
Note: Data are expressed as number and percentage.
12 (33.4%) out of the 33 reversible perfusion defects were described as
mild, 14 (42.4%) – moderate, and 7 (22.2%) – severe.
31 (88.6%) patients out of the 35 with abnormal MPI findings represent-
ed an abnormal coronary angiography. In 15(48.4%) out of the 31 patients it was
defined as 1 vessel disease, in 10 (32.3%) – 2 vessels disease and in 6 (19.3%) – 3
vessels disease. 9 (29.0%) patients with positive angiographic results represent-
ed diffuse disease and vessel occlusion was detected in 2 (6.5%). Coronary anat-
omy did not allow any revascularisation procedure in 13 (41.9%) of the patients
with abnormal coronary angiography.
These results emphasize the incremental diagnostic value of MPI for eval-
uation of SMI in this specific subgroup of the diabetic population. MPI have
showed a very good degree of specificity of the test (97.6%) with a positive pre-
dictive value of 88.9% for predicting angiographic coronary stenosis (Table3).
Table 3: Evaluation of MPI in predicting angiographic coronary stenosis.
Statistic Value 95% CI
Sensitivity (%) 69.5 61.5–82.6
Specificity (%) 97.6 79.9–99.3
PPV (%) 88.9 73.6–95.6
NPV (%) 50.6 48.9–52.3
Note: PPV: positive predictive value; NPV: negative predictive value; CI: confidence intervals