Page 183 - Petelin, Ana, Nejc Šarabon, Boštjan Žvanut, eds. 2017. Zdravje delovno aktivne populacije ▪︎ Health of the Working-Age Population. Proceedings. Koper: Založba Univerze na Primorskem/University of Primorska Press
P. 183
Methods association between perceived stress, self-rated health, work productivity and stress management intervention 181
Data for his cross-sectional study were collected in March 2016 as part of the
project ‘Zdravi na kvadrat II’ (engl.: ‘Healthy on a square II’) – workplace
health promotion for employees in the chemical and other processing indus-
tries, conducted in 17 Slovenian companies in processing industry (n=2 small-
sized companies (<50 employees); n=11 middle-sized (50-250 employees); n=4
large-sized (>250 employees)). 2-74% of the population size of included organi-
sations completed the self-administered questionnaire.
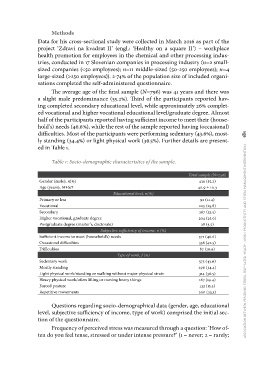
The average age of the final sample (N=796) was 41 years and there was
a slight male predominance (55.2%). Third of the participants reported hav-
ing completed secondary educational level, while approximately 26% complet-
ed vocational and higher vocational educational level/graduate degree. Almost
half of the participants reported having sufficient income to meet their (house-
hold’s) needs (46.6%), while the rest of the sample reported having (occasional)
difficulties. Most of the participants were performing sedentary (43.6%), most-
ly standing (34.4%) or light physical work (36.5%). Further details are present-
ed in Table 1.
Table 1: Socio-demographic characteristics of the sample.
Gender (male), n(%) Total sample (N=796)
Age (years), M±SD 439 (55.2)
40.9 ± 10.3
Educational level, n(%)
Primary or less 92 (11.4)
Vocational 205 (25.8)
Secondary 267 (33.5)
Higher vocational, graduate degree 204 (25.6)
Postgraduate degree (master‘s, doctorate)
28 (3.5)
Subjective sufficiency of income, n (%)
Sufficient income to meet (household‘s) needs 371 (46.6)
Occasional difficulties 338 (42.5)
Difficulties 87 (10.9)
Type of work, f (%) 375 (43.6)
Sedentary work 296 (34.4)
Mostly standing 314 (36.5)
Light physical work/standing or walking without major physical strain 167 (19.4)
Heavy physical work/often lifting or moving heavy things 132 (15.3)
Forced posture 200 (23.3)
Repetitive movements
Questions regarding socio-demographical data (gender, age, educational
level, subjective sufficiency of income, type of work) comprised the initial sec-
tion of the questionnaire.
Frequency of perceived stress was measured through a question: ‘How of-
ten do you feel tense, stressed or under intense pressure?’ (1 – never; 2 – rarely;
Data for his cross-sectional study were collected in March 2016 as part of the
project ‘Zdravi na kvadrat II’ (engl.: ‘Healthy on a square II’) – workplace
health promotion for employees in the chemical and other processing indus-
tries, conducted in 17 Slovenian companies in processing industry (n=2 small-
sized companies (<50 employees); n=11 middle-sized (50-250 employees); n=4
large-sized (>250 employees)). 2-74% of the population size of included organi-
sations completed the self-administered questionnaire.
The average age of the final sample (N=796) was 41 years and there was
a slight male predominance (55.2%). Third of the participants reported hav-
ing completed secondary educational level, while approximately 26% complet-
ed vocational and higher vocational educational level/graduate degree. Almost
half of the participants reported having sufficient income to meet their (house-
hold’s) needs (46.6%), while the rest of the sample reported having (occasional)
difficulties. Most of the participants were performing sedentary (43.6%), most-
ly standing (34.4%) or light physical work (36.5%). Further details are present-
ed in Table 1.
Table 1: Socio-demographic characteristics of the sample.
Gender (male), n(%) Total sample (N=796)
Age (years), M±SD 439 (55.2)
40.9 ± 10.3
Educational level, n(%)
Primary or less 92 (11.4)
Vocational 205 (25.8)
Secondary 267 (33.5)
Higher vocational, graduate degree 204 (25.6)
Postgraduate degree (master‘s, doctorate)
28 (3.5)
Subjective sufficiency of income, n (%)
Sufficient income to meet (household‘s) needs 371 (46.6)
Occasional difficulties 338 (42.5)
Difficulties 87 (10.9)
Type of work, f (%) 375 (43.6)
Sedentary work 296 (34.4)
Mostly standing 314 (36.5)
Light physical work/standing or walking without major physical strain 167 (19.4)
Heavy physical work/often lifting or moving heavy things 132 (15.3)
Forced posture 200 (23.3)
Repetitive movements
Questions regarding socio-demographical data (gender, age, educational
level, subjective sufficiency of income, type of work) comprised the initial sec-
tion of the questionnaire.
Frequency of perceived stress was measured through a question: ‘How of-
ten do you feel tense, stressed or under intense pressure?’ (1 – never; 2 – rarely;