Page 50 - Fister jr., Iztok, and Andrej Brodnik (eds.). StuCoSReC. Proceedings of the 2018 5th Student Computer Science Research Conference. Koper: University of Primorska Press, 2018
P. 50
e () = 50. The Stopping Criterion for both CS and K-means K-
[22] is the number of Fitness Evaluations (FEs), and the mean
maximum number of FEs (i.e. MAX_FE) has been taken as s
1000 × . Where, is the number of clusters. In K-means, new
centroid calculation has been considered as Fitness Evaluations (d) (e) (f)
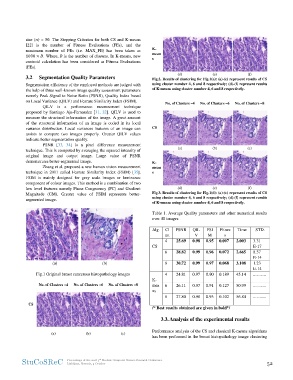
(FEs). Fig.2. Results of clustering for Fig.1(a): (a)-(c) represent results of CS
using cluster number 4, 6 and 8 respectively; (d)-(f) represent results
3.2 Segmentation Quality Parameters of K-means using cluster number 4, 6 and 8 respectively.
Segmentation efficiency of the employed methods are judged with No. of Clusters =4 No. of Clusters =6 No. of Clusters =8
the help of three well-known image quality assessment parameters
namely Peak Signal to Noise Ratio (PSNR), Quality Index based CS
on Local Variance (QILV) and Feature Similarity Index (FSIM).
(a) (b) (c)
QILV is a performance measurement technique
proposed by Santiago Aja-Fernandez [31, 32]. QILV is used to K-
measure the structural information of the image. A great amount mean
of the structural information of an image is coded in its local s
variance distribution. Local variances features of an image can
assists to compare two images properly. Greater QILV values (d) (e) (f)
indicate better segmentation quality. Fig.3. Results of clustering for Fig.1(d): (a)-(c) represent results of CS
using cluster number 4, 6 and 8 respectively; (d)-(f) represent results
PSNR [33, 34] is a pixel difference measurement of K-means using cluster number 4, 6 and 8 respectively.
technique. This is computed by averaging the squared intensity of
original image and output image. Large value of PSNR Table 1. Average Quality parameters and other numerical results
demonstrates better-segmented image. over 40 images
Zhang et al. proposed a new human vision measurement Alg. Cl PSNR QIL FSI Fitnes Time STD.
technique in 2011 called Feature Similarity Index (FSIM) [35].
FSIM is mainly designed for gray scale images or luminance us. VM s
component of colour images. This method is a combination of two
low level features namely Phase Congruency (PC) and Gradient 4 25.69 0.98 0.95 0.097 2.003 3.31
Magnitude (GM). Greater value of FSIM represents better-
segmented image. CS E-17
(a) (b) 6 28.82 0.99 0.96 0.072 2.665 8.37
Fig.1 Original breast cancerous histopathology images E-14
No. of Clusters =4 No. of Clusters =6 No. of Clusters =8 8 30.72 0.99 0.97 0.068 3.108 1.23
CS E-14
(a) (b) (c) 4 24.81 0.97 0.90 0.189 45.14 ............
K-
mea 6 26.11 0.97 0.91 0.127 50.99 ............
ns
8 27.80 0.98 0.93 0.102 56.84 ............
/* Best results obtained are given in bold*/
3.3. Analysis of the experimental results
Performance analysis of the CS and classical K-means algorithms
has been performed in the breast histopathology image clustering
StuCoSReC Proceedings of the 2018 5th Student Computer Science Research Conference 52
Ljubljana, Slovenia, 9 October
[22] is the number of Fitness Evaluations (FEs), and the mean
maximum number of FEs (i.e. MAX_FE) has been taken as s
1000 × . Where, is the number of clusters. In K-means, new
centroid calculation has been considered as Fitness Evaluations (d) (e) (f)
(FEs). Fig.2. Results of clustering for Fig.1(a): (a)-(c) represent results of CS
using cluster number 4, 6 and 8 respectively; (d)-(f) represent results
3.2 Segmentation Quality Parameters of K-means using cluster number 4, 6 and 8 respectively.
Segmentation efficiency of the employed methods are judged with No. of Clusters =4 No. of Clusters =6 No. of Clusters =8
the help of three well-known image quality assessment parameters
namely Peak Signal to Noise Ratio (PSNR), Quality Index based CS
on Local Variance (QILV) and Feature Similarity Index (FSIM).
(a) (b) (c)
QILV is a performance measurement technique
proposed by Santiago Aja-Fernandez [31, 32]. QILV is used to K-
measure the structural information of the image. A great amount mean
of the structural information of an image is coded in its local s
variance distribution. Local variances features of an image can
assists to compare two images properly. Greater QILV values (d) (e) (f)
indicate better segmentation quality. Fig.3. Results of clustering for Fig.1(d): (a)-(c) represent results of CS
using cluster number 4, 6 and 8 respectively; (d)-(f) represent results
PSNR [33, 34] is a pixel difference measurement of K-means using cluster number 4, 6 and 8 respectively.
technique. This is computed by averaging the squared intensity of
original image and output image. Large value of PSNR Table 1. Average Quality parameters and other numerical results
demonstrates better-segmented image. over 40 images
Zhang et al. proposed a new human vision measurement Alg. Cl PSNR QIL FSI Fitnes Time STD.
technique in 2011 called Feature Similarity Index (FSIM) [35].
FSIM is mainly designed for gray scale images or luminance us. VM s
component of colour images. This method is a combination of two
low level features namely Phase Congruency (PC) and Gradient 4 25.69 0.98 0.95 0.097 2.003 3.31
Magnitude (GM). Greater value of FSIM represents better-
segmented image. CS E-17
(a) (b) 6 28.82 0.99 0.96 0.072 2.665 8.37
Fig.1 Original breast cancerous histopathology images E-14
No. of Clusters =4 No. of Clusters =6 No. of Clusters =8 8 30.72 0.99 0.97 0.068 3.108 1.23
CS E-14
(a) (b) (c) 4 24.81 0.97 0.90 0.189 45.14 ............
K-
mea 6 26.11 0.97 0.91 0.127 50.99 ............
ns
8 27.80 0.98 0.93 0.102 56.84 ............
/* Best results obtained are given in bold*/
3.3. Analysis of the experimental results
Performance analysis of the CS and classical K-means algorithms
has been performed in the breast histopathology image clustering
StuCoSReC Proceedings of the 2018 5th Student Computer Science Research Conference 52
Ljubljana, Slovenia, 9 October