Page 89 - Petelin, Ana. 2020. Ed. Zdravje delovno aktivne populacije / Health of the Working-Age Population. Proceedings. Koper: University of Primorska Press.
P. 89
determine the knowledge of consumers about providing safe food, their be-
haviour during the preparation of selected foods and the hygienic conditions
in home kitchens. Due to the scope of the research, the paper presents only the
results of a questionnaire on consumer knowledge of food safety.
Methods ensuring safe food preparation among slovenian consumers 87
Consumer surveys on ensuring safe food preparation
To test consumers’ knowledge of food safety, we used a validated question-
naire, mostly based on a questionnaire from the Food and Drug Administra-
tion (2010). Additional questions were added in order to compare the data with
the previous Slovenian survey on consumer knowledge of food safety from
2008 (Jevšnik et al., 2008).
The questionnaire was entered into the 1KA online survey application
and a web link to the survey questionnaire was sent to consumers via e-mail
and social networks. A t-test for independent samples with the significance lev-
el of p < 0,05 was used for the statistical analysis of the obtained data.
Results
Due to the scope of the research, the paper presents only the results regarding
consumer knowledge in the field of food safety. The online survey was started
in November 2018 and completed in April 2019. Only relevant units that were
fully (n = 260) or partially completed (n = 80), a total of 340 survey, were used
for the analysis of the questionnaire. The largest number of respondents who
completed the questionnaire was from the first age group (n=171, 50%), followed
by respondents from the second age group (n = 107, 31 %) and from the third age
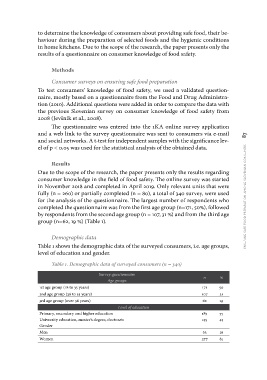
group (n=62, 19 %) (Table 1).
Demographic data
Table 1 shows the demographic data of the surveyed consumers, i.e. age groups,
level of education and gender.
Table 1. Demographic data of surveyed consumers (n = 340)
Survey questionnaire n%
Age groups 171 50
107 31
1st age group (18 to 35 years) 62 19
2nd age group (36 to 55 years) 185 55
155 45
3rd age group (over 56 years)
63 19
Level of education 277 81
Primary, secondary and higher education
University education, master’s degree, doctorate
Gender
Men
Women
haviour during the preparation of selected foods and the hygienic conditions
in home kitchens. Due to the scope of the research, the paper presents only the
results of a questionnaire on consumer knowledge of food safety.
Methods ensuring safe food preparation among slovenian consumers 87
Consumer surveys on ensuring safe food preparation
To test consumers’ knowledge of food safety, we used a validated question-
naire, mostly based on a questionnaire from the Food and Drug Administra-
tion (2010). Additional questions were added in order to compare the data with
the previous Slovenian survey on consumer knowledge of food safety from
2008 (Jevšnik et al., 2008).
The questionnaire was entered into the 1KA online survey application
and a web link to the survey questionnaire was sent to consumers via e-mail
and social networks. A t-test for independent samples with the significance lev-
el of p < 0,05 was used for the statistical analysis of the obtained data.
Results
Due to the scope of the research, the paper presents only the results regarding
consumer knowledge in the field of food safety. The online survey was started
in November 2018 and completed in April 2019. Only relevant units that were
fully (n = 260) or partially completed (n = 80), a total of 340 survey, were used
for the analysis of the questionnaire. The largest number of respondents who
completed the questionnaire was from the first age group (n=171, 50%), followed
by respondents from the second age group (n = 107, 31 %) and from the third age
group (n=62, 19 %) (Table 1).
Demographic data
Table 1 shows the demographic data of the surveyed consumers, i.e. age groups,
level of education and gender.
Table 1. Demographic data of surveyed consumers (n = 340)
Survey questionnaire n%
Age groups 171 50
107 31
1st age group (18 to 35 years) 62 19
2nd age group (36 to 55 years) 185 55
155 45
3rd age group (over 56 years)
63 19
Level of education 277 81
Primary, secondary and higher education
University education, master’s degree, doctorate
Gender
Men
Women