Page 224 - Petelin, Ana, Nejc Šarabon, Boštjan Žvanut, eds. 2017. Zdravje delovno aktivne populacije ▪︎ Health of the Working-Age Population. Proceedings. Koper: Založba Univerze na Primorskem/University of Primorska Press
P. 224
Table 1: The number of employees by the occupation.
Occupation
Year Maintenance Office workers Train drivers Wagon inspectors
workers
2007 473 1670 1038 237
481 1708 1072 228
2008 443 1735 1090 245
416 1553 958 193
2009 378 1387 917 191
334 1371 892 195
The num- 2010 315 1714 880 192
ber of em- 2011 344 1417 922 190
ployees 2012 322 1757 871 180
390 1590 960 206
2013
2014
zdravje delovno aktivne populacije | health of the working-age population 222 2015
Average 2007-2015
Results
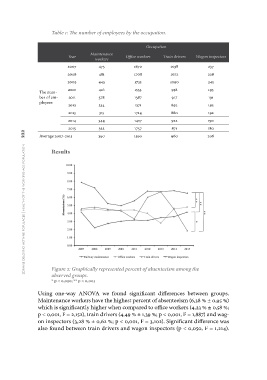
Figure 2: Graphically represented percent of absenteeism among the
observed groups.
* p < 0,050; ** p < 0,001
Using one-way ANOVA we found significant differences between groups.
Maintenance workers have the highest percent of absenteeism (6,38 % ± 0,95 %)
which is significantly higher when compared to office workers (4,23 % ± 0,58 %;
p < 0,001, F = 2,152), train drivers (4,49 % ± 1,39 %; p < 0,001, F = 1,887) and wag-
on inspectors (3,28 % ± 0,62 %; p < 0,001, F = 3,102). Significant difference was
also found between train drivers and wagon inspectors (p < 0,050, F = 1,214).
Occupation
Year Maintenance Office workers Train drivers Wagon inspectors
workers
2007 473 1670 1038 237
481 1708 1072 228
2008 443 1735 1090 245
416 1553 958 193
2009 378 1387 917 191
334 1371 892 195
The num- 2010 315 1714 880 192
ber of em- 2011 344 1417 922 190
ployees 2012 322 1757 871 180
390 1590 960 206
2013
2014
zdravje delovno aktivne populacije | health of the working-age population 222 2015
Average 2007-2015
Results
Figure 2: Graphically represented percent of absenteeism among the
observed groups.
* p < 0,050; ** p < 0,001
Using one-way ANOVA we found significant differences between groups.
Maintenance workers have the highest percent of absenteeism (6,38 % ± 0,95 %)
which is significantly higher when compared to office workers (4,23 % ± 0,58 %;
p < 0,001, F = 2,152), train drivers (4,49 % ± 1,39 %; p < 0,001, F = 1,887) and wag-
on inspectors (3,28 % ± 0,62 %; p < 0,001, F = 3,102). Significant difference was
also found between train drivers and wagon inspectors (p < 0,050, F = 1,214).