Page 88 - Petelin, Ana, Nejc Šarabon, Boštjan Žvanut, eds. 2017. Zdravje delovno aktivne populacije ▪︎ Health of the Working-Age Population. Proceedings. Koper: Založba Univerze na Primorskem/University of Primorska Press
P. 88
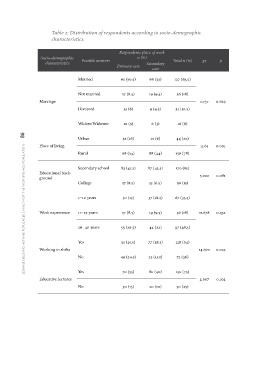
Table 2: Distribution of respondents according to socio-demographic
characteristics.
Socio-demographic Possible answers Respondents place of work Total n (%) χ2 p
characteristics n (%) 127 (63,5)
Primary care Secondary
care
Married 61 (30.5) 66 (33)
Marriage Not married 17 (8.5) 19 (9,5) 36 (18) 1.737 0.629
Divorced 12 (6) 9 (4.5) 21 (10.5)
Widow/Widower 10 (5) 6 (3) 16 (8)
zdravje delovno aktivne populacije | health of the working-age population 86 Place of living Urban 32 (16) 12 (6) 44 (22) 11.65 0.001
Rural 68 (34) 88 (44) 156 (78)
Educational back- Secondary school 83 (41.5) 87 (43.5) 170 (85) 5.022 0.081
ground College 17 (8.5) 13 (6.5) 30 (15)
1−10 years 30 (15) 37 (18.5) 67 (33.5)
Work experience 11−25 years 17 (8.5) 19 (9.5) 36 (18) 11.678 0.432
26−40 years 53 (26.5) 44 (22) 97 (48,5)
Working in shifts Yes 51 (25.5) 77 (38.5) 128 (64) 14.670 0.023
No 49 (24.5) 23 (11.5) 72 (36)
Educative lectures Yes 70 (35) 80 (40) 150 (75) 2.667 0.102
No 30 (15) 20 (10) 50 (25)