Page 53 - Petelin, Ana, and Šarabon, Nejc. 2018. Eds. Zdravje starostnikov / Health of the Elderly. Znanstvena monografija / Proceedings. Koper: University of Primorska Press
P. 53
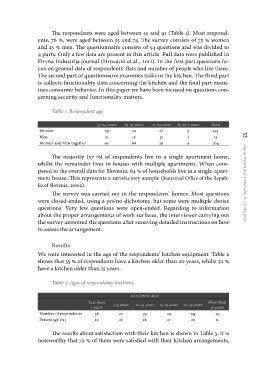
The respondents were aged between 55 and 91 (Table 1). Most respond-
ents, 76 %, were aged between 55 and 74. The survey consists of 75 % women
and 25 % men. The questionnaire consists of 54 questions and was divided to
4 parts. Only a few data are present in this article. Full data were published in
Drvna Industrija journal (Hrovatin et al., 2012). In the first part questions fo-
cus on general data of respondents’ flats and number of people who live there.
The second part of questionnaire examines tasks in the kitchen. The third part
is collects functionality data concerning the kitchen and the final part exam-
ines consumer behavior. In this paper we have been focused on questions con-
cerning security and functionality matters.
Table 1: Respondent age
Women 55-64 years 65-74 years 75-84 years 85-90+ years Total adaptability in living space for elderly people 53
Men 69 50 27 7 153
Women and Men together 21 16 12 2 51
90 66 39 9 204
The majority (57 %) of respondents live in a single apartment home,
whilst the remainder lives in houses with multiple apartments. When com-
pared to the overall data for Slovenia, 64 % of households live in a single-apart-
ment house. This represents a satisfactory sample (Statistical Office of the Repub-
lic of Slovenia, 2002).
The survey was carried out in the respondents’ homes. Most questions
were closed-ended, using a yes/no dichotomy, but some were multiple choice
questions. Very few questions were open-ended. Regarding to information
about the proper arrangements of work surfaces, the interviewer carrying out
the survey answered the questions after receiving detailed instructions on how
to assess the arrangement.
Results
We were interested in the age of the respondents’ kitchen equipment. Table 2
shows that 35 % of respondents have a kitchen older than 20 years, whilst 52 %
have a kitchen older than 15 years.
Table 2: Ages of respondents’ kitchens
KITCHEN AGE
Number of respondents Less than 5-9 years 10-14 years 15-19 years 20-29 years More than
Percentage (%) 5 years 30 years
38 27 33 34 59 13
19 13 16 17 29 6
The results about satisfaction with their kitchen is shown in Table 3. It is
noteworthy that 72 % of them were satisfied with their kitchen arrangements,