Page 115 - Kukanja Gabrijelčič, Mojca, and Maruška Seničar Željeznov, eds. 2018. Teaching Gifted and Talented Children in A New Educational Era. Koper: University of Primorska Press.
P. 115
Excellence in Pupils and Teachers’ Attitudes Towards Science
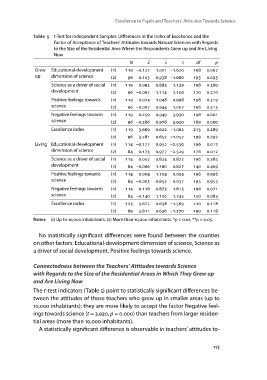
Table 5 t-Test for Independent Samples: Differences in the Index of Excellence and the
Factor of Acceptance of Teachers’ Attitudes towards Natural Sciences with Regards
to the Size of the Residential Area Where the Respondents Grew up and Are Living
Now
Grew Educational-development () Nx st df p
up dimension of science () –. . –. .
() . –. .
Science as a driver of social () . . . .
development () . . . .
() . . .
Positive feelings towards () –. . . .
science () . . . .
() . . .
Negative feelings towards () –. . –. .
science () . . –. .
() . –. .
Excellence index () –. . –. .
() . . . .
Living Educational-development () . . .
dimension of science () . . . .
() –. . . .
Science as a driver of social () . . .
development () . . . .
() . . –. .
Positive feelings towards . –. .
science –.
.
Negative feelings towards
science –.
.
Excellence index
–.
.
.
Notes (1) Up to 10,000 inhabitants. (2) More than 10,000 inhabitants. *p < 0.01, **p < 0.05.
No statistically significant differences were found between the counties
on other factors: Educational-development dimension of science, Science as
a driver of social development, Positive feelings towards science.
Connectedness between the Teachers’ Attitudes towards Science
with Regards to the Size of the Residential Areas in Which They Grew up
and Are Living Now
The t-test indicators (Table 5) point to statistically significant differences be-
tween the attitudes of those teachers who grew up in smaller areas (up to
10,000 inhabitants); they are more likely to accept the factor Negative feel-
ings towards science (t = 3.930, p = 0.000) than teachers from larger residen-
tial areas (more than 10,000 inhabitants).
A statistically significant difference is observable in teachers’ attitudes to-
113