Page 41 - Kukanja Gabrijelčič, Mojca, and Maruška Seničar Željeznov, eds. 2018. Teaching Gifted and Talented Children in A New Educational Era. Koper: University of Primorska Press.
P. 41
Exploring Dutch Students’ Implicit Theories of an Intelligent Person
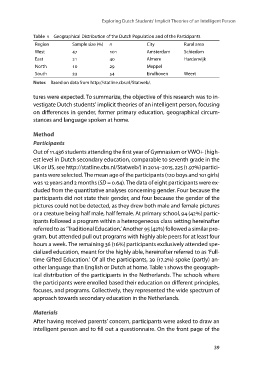
Table 1 Geographical Distribution of the Dutch Population and of the Participants
Region Sample size () n City Rural area
West Amsterdam Schiedam
East Almere Harderwijk
North Meppel
South Eindhoven Weert
Notes Based on data from http://statline.cbs.nl/Statweb/.
tures were expected. To summarize, the objective of this research was to in-
vestigate Dutch students’ implicit theories of an intelligent person, focusing
on differences in gender, former primary education, geographical circum-
stances and language spoken at home.
Method
Participants
Out of 11.436 students attending the first year of Gymnasium or VWO+ (high-
est level in Dutch secondary education, comparable to seventh grade in the
UK or US, see http://statline.cbs.nl/Statweb/) in 2014–2015, 225 (1.97) partici-
pants were selected. The mean age of the participants (120 boys and 101 girls)
was 12 years and 2 months (SD = 0.64). The data of eight participants were ex-
cluded from the quantitative analyses concerning gender. Four because the
participants did not state their gender, and four because the gender of the
pictures could not be detected, as they drew both male and female pictures
or a creature being half male, half female. At primary school, 94 (42) partic-
ipants followed a program within a heterogeneous class setting hereinafter
referred to as ‘Traditional Education.’ Another 95 (42) followed a similar pro-
gram, but attended pull out programs with highly able peers for at least four
hours a week. The remaining 36 (16) participants exclusively attended spe-
cialized education, meant for the highly able, hereinafter referred to as ‘Full-
time Gifted Education.’ Of all the participants, 39 (17.2) spoke (partly) an-
other language than English or Dutch at home. Table 1 shows the geograph-
ical distribution of the participants in the Netherlands. The schools where
the participants were enrolled based their education on different principles,
focuses, and programs. Collectively, they represented the wide spectrum of
approach towards secondary education in the Netherlands.
Materials
After having received parents’ concern, participants were asked to draw an
intelligent person and to fill out a questionnaire. On the front page of the
39