Page 44 - Fister jr., Iztok, and Andrej Brodnik (eds.). StuCoSReC. Proceedings of the 2018 5th Student Computer Science Research Conference. Koper: University of Primorska Press, 2018
P. 44
imum and minimum vertical acceleration values within Value of tunable constant 0.38
a step. Similarly, Do et al. [3] based their model on verti- 0.36
cal displacement of the centre of body mass. This model 0.34
includes user’s leg length, but it does not include any tune- 0.32
able constants.
0.3
2.3 Angle-based models 0.28
0.26
Angle-based models require the opening angle of the leg as 0.24
an input. They often exploit linear relationship between 0.22
step length and the opening angle of the leg. Diaz and Gon-
zales [8] proposed such model. It includes two tuneable con- 0.2
stants. 0.4 0.6 0.8 1 1.2 1.4 1.6 1.8
Average walking speed [m/s]
2.4 Multiparameter models 2
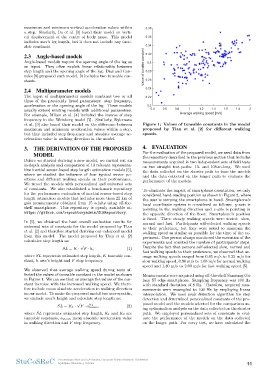
The input of multiparameter models combines two or all Figure 1: Values of tuneable constants in the model
three of the previously listed parameters: step frequency, proposed by Tian et al. [2] for different walking
acceleration or the opening angle of the leg. These models speeds.
usually extend existing models with additional parameters.
For example, Mikov et al. [4] included the inverse of step
frequency in the Weinberg model [7]. Similarly, Bylemans
et al. [9] also based their model on the difference between
maximum and minimum acceleration values within a step,
but they included step frequency and absolute average ac-
celeration value in walking direction in the model.
3. THE DERIVATION OF THE PROPOSED 4. EVALUATION
MODEL For the evaluation of the proposed model, we used data from
the repository described in the previous section that includes
Before we started deriving a new model, we carried out an measurements acquired in two independent sets of field tests
in-depth analysis and comparison of 13 relevant representa- on two straight test paths: 15- and 108-m-long. We used
tive inertial sensor-based step length estimation models [5], the data collected on the shorter path to tune the models
where we studied the influence of four typical sensor po- and the data collected on the longer path to evaluate the
sitions and different walking speeds on their performance. performance of the models.
We tuned the models with personalized and universal sets
of constants. We also established a benchmark repository To eliminate the impact of smartphone orientation, we only
for the performance evaluation of inertial sensor-based step considered hand-reading position as shown in Figure 2, where
length estimation models that includes more than 22 km of the user is carrying the smartphone in hand. Smartphone’s
gait measurements obtained from 15 adults using off-the- local coordinate system is considered as follows: y-axis is
shelf smartphone. This repository is openly available at: pointing in the walking direction and z-axis is pointing in
https://github.com/repositoryadmin/SLERepository. the opposite direction of the floor. Smartphone’s position
is fixed. Three steady walking speeds were tested: slow,
In [5], we obtained the best overall evaluation results for normal and fast. Participants self-selected walking speeds
to their preference, but they were asked to maintain the
universal sets of constants for the model proposed by Tian walking speed as similar as possible for the time of the ex-
periment. One person always monitored the execution of the
et al. [2] and therefore started deriving our enhanced model experiments and counted the number of participants’ steps.
Despite the fact that persons self-selected slow, normal and
from this model. The model proposed by Tian et al. [2] fast walking speeds to their preference, we observed that av-
erage walking speeds ranged from 0.45 m/s to 1.25 m/s for
calculates step length as: (1) slow walking speed, 0.90 m/s to 1.65 m/s for normal walking
√ speed and 1.40 m/s to 2.00 m/s for fast walking speed [5].
SL = K · F · h, Measurements were acquired using off-the-shelf Samsung Ga-
laxy S7 edge smartphone. Sampling frequency was 100 Hz
where SL represents estimated step length, K tuneable con- with standard deviation of 8 Hz. Therefore, acquired mea-
stant, h user’s height and F step frequency. surements were resampled to 100 Hz by employing linear
interpolation. We used peak detection algorithm for step
We observed that average walking speed during tests af- detection and determined personalized constants of the pro-
posed model and the models selected for the comparison us-
fected the values of tuneable constant in the model as shown ing optimization analysis on the data collected on the shorter
path. We employed personalized sets of constants to eval-
in Figure 1. We can see that on average the values of the con- uate the performance of the models on the data collected
on the longer path. For every test, we have calculated the
stant increase with the increased walking speed. We there-
fore include mean absolute acceleration in walking direction
in our model. To make the proposed model less user-specific,
we exclude user’s height and calculate step length as:
√ (2)
SL = K1 · F · amK2ean,
where SL represents estimated step length, K1 and K2 are
tuneable constants, amean mean absolute acceleration value
in walking direction and F step frequency.
StuCoSReC Proceedings of the 2018 5th Student Computer Science Research Conference 44
Ljubljana, Slovenia, 9 October
a step. Similarly, Do et al. [3] based their model on verti- 0.36
cal displacement of the centre of body mass. This model 0.34
includes user’s leg length, but it does not include any tune- 0.32
able constants.
0.3
2.3 Angle-based models 0.28
0.26
Angle-based models require the opening angle of the leg as 0.24
an input. They often exploit linear relationship between 0.22
step length and the opening angle of the leg. Diaz and Gon-
zales [8] proposed such model. It includes two tuneable con- 0.2
stants. 0.4 0.6 0.8 1 1.2 1.4 1.6 1.8
Average walking speed [m/s]
2.4 Multiparameter models 2
The input of multiparameter models combines two or all Figure 1: Values of tuneable constants in the model
three of the previously listed parameters: step frequency, proposed by Tian et al. [2] for different walking
acceleration or the opening angle of the leg. These models speeds.
usually extend existing models with additional parameters.
For example, Mikov et al. [4] included the inverse of step
frequency in the Weinberg model [7]. Similarly, Bylemans
et al. [9] also based their model on the difference between
maximum and minimum acceleration values within a step,
but they included step frequency and absolute average ac-
celeration value in walking direction in the model.
3. THE DERIVATION OF THE PROPOSED 4. EVALUATION
MODEL For the evaluation of the proposed model, we used data from
the repository described in the previous section that includes
Before we started deriving a new model, we carried out an measurements acquired in two independent sets of field tests
in-depth analysis and comparison of 13 relevant representa- on two straight test paths: 15- and 108-m-long. We used
tive inertial sensor-based step length estimation models [5], the data collected on the shorter path to tune the models
where we studied the influence of four typical sensor po- and the data collected on the longer path to evaluate the
sitions and different walking speeds on their performance. performance of the models.
We tuned the models with personalized and universal sets
of constants. We also established a benchmark repository To eliminate the impact of smartphone orientation, we only
for the performance evaluation of inertial sensor-based step considered hand-reading position as shown in Figure 2, where
length estimation models that includes more than 22 km of the user is carrying the smartphone in hand. Smartphone’s
gait measurements obtained from 15 adults using off-the- local coordinate system is considered as follows: y-axis is
shelf smartphone. This repository is openly available at: pointing in the walking direction and z-axis is pointing in
https://github.com/repositoryadmin/SLERepository. the opposite direction of the floor. Smartphone’s position
is fixed. Three steady walking speeds were tested: slow,
In [5], we obtained the best overall evaluation results for normal and fast. Participants self-selected walking speeds
to their preference, but they were asked to maintain the
universal sets of constants for the model proposed by Tian walking speed as similar as possible for the time of the ex-
periment. One person always monitored the execution of the
et al. [2] and therefore started deriving our enhanced model experiments and counted the number of participants’ steps.
Despite the fact that persons self-selected slow, normal and
from this model. The model proposed by Tian et al. [2] fast walking speeds to their preference, we observed that av-
erage walking speeds ranged from 0.45 m/s to 1.25 m/s for
calculates step length as: (1) slow walking speed, 0.90 m/s to 1.65 m/s for normal walking
√ speed and 1.40 m/s to 2.00 m/s for fast walking speed [5].
SL = K · F · h, Measurements were acquired using off-the-shelf Samsung Ga-
laxy S7 edge smartphone. Sampling frequency was 100 Hz
where SL represents estimated step length, K tuneable con- with standard deviation of 8 Hz. Therefore, acquired mea-
stant, h user’s height and F step frequency. surements were resampled to 100 Hz by employing linear
interpolation. We used peak detection algorithm for step
We observed that average walking speed during tests af- detection and determined personalized constants of the pro-
posed model and the models selected for the comparison us-
fected the values of tuneable constant in the model as shown ing optimization analysis on the data collected on the shorter
path. We employed personalized sets of constants to eval-
in Figure 1. We can see that on average the values of the con- uate the performance of the models on the data collected
on the longer path. For every test, we have calculated the
stant increase with the increased walking speed. We there-
fore include mean absolute acceleration in walking direction
in our model. To make the proposed model less user-specific,
we exclude user’s height and calculate step length as:
√ (2)
SL = K1 · F · amK2ean,
where SL represents estimated step length, K1 and K2 are
tuneable constants, amean mean absolute acceleration value
in walking direction and F step frequency.
StuCoSReC Proceedings of the 2018 5th Student Computer Science Research Conference 44
Ljubljana, Slovenia, 9 October