Page 56 - Fister jr., Iztok, and Andrej Brodnik (eds.). StuCoSReC. Proceedings of the 2018 5th Student Computer Science Research Conference. Koper: University of Primorska Press, 2018
P. 56
e PyWavelets was used. Training and testing was done 4. CONCLUSION
on the following computer hardware:
Highest achieved classification accuracy on test datasets was
• Intel Core i7-6700K processor 99.96%, with average across all three classification models
• 16GB of DDR4 3200MHz memory being 85.75%. Feature extraction approach is appropriate
for use in various industry related problems and at analysis
Various open-source time series datasets [2] were used for of stock market, but medical use is questionable, because
testing and are described in Table 1. Each dataset contains achieved accuracy must be at highest level possible to ensure
time series of equal length and split in two classes or more. medical safety. Best such case are classification scores for
Testing was done using 5-fold cross-validation with F1 score time series ECG5000, where highest achieved F1 score is
as classification accuracy measurement for all classification 86.89%, much lower than satisfying for critical medical data.
algorithms, presented in Chapter 2.4. Dictionaries contain-
ing 2000 words were used. Parameters Wc and moving step Parallel computing can be used for extraction of segments
tc were choosen individually for every time series. The rea- and at defining time series feature vectors. Presented feature
son being is that their lengths differ and experimenting with extraction approach is appropriate for integration in real-
different parameter values was needed to reach best possible time systems and IoT devices, however training phase should
classification score. Classification results are presented in be done separately from working environment. Higher clas-
Table 2. sification accuracy could be achieved with use of multivariate
time series.
Table 1: Time series descriptions
5. REFERENCES
Time series Description
CBF Simulated time series [1] V. Asha, N. U. Bhajantri, and P. Nagabhushan.
ECG5000 ECG signal of a patient GLCM based Chi-square Histogram Distance for
FordA having a heart failure Automatic Detection of Defects on Patterned
Mallat Engine sounds Textures. International Journal of Computational
ShapesAll Simulated time series Vision and Robotics, 2(4):302–313, 2011.
Binary images contours
UWaveGestureLibraryAll distances from center [2] A. Bagnall, J. Lines, W. Vickers, and E. Keogh. The
Accelerometer data gene- UEA and UCR Time Series Classification Repository.
StarlighCurves rated during hand movement Available at www.timeseriesclassification.com.
Brightness of astronomical
Wafer objects through time [3] P.M. Bentley and J.T.E. McDonnell. Wavelet
Measurements recorded from transforms: an introduction. Electronics and
sensors during the processing Communication Engineering Journal, 6(4):175–186,
of silicon wafers 1994.
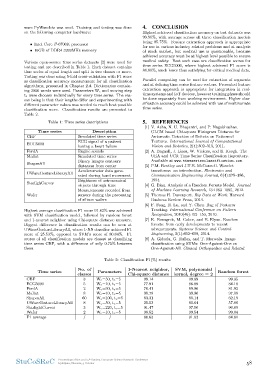
Highest average classification F1 score 91.82% was achieved [4] G. Biau. Analysis of a Random Forests Model. Journal
with SVM classification model, followed by random forest of Machine Learning Research, 13:1063–1095, 2012.
and 1-nearest neighbor using Chi-square distance measure.
Biggest difference in classification results can be seen at [5] Thomas H. Davenport. Big Data at Work. Harvard
UWaveGestureLibraryAll, where 1-NN classifier achieved F1 Business Review Press, 2014.
score of 25.53%, opposed to SVM’s score of 80.64%. F1
scores of all classification models are closest at classifying [6] F. Fang, H. Lu, and Y. Chen. Bag of Features
time series CBF, with a difference of only 0.75% between Tracking. International Conference on Pattern
them. Recognition, 2010(46):153–156, 2010.
[7] K. Fawagreh, M. Gaber, and E. Elyan. Random
forests: from early developments to recent
advancements. Systems Science and Control
Engineering, 2(1):602–609, 2014.
[8] A. Gidudu, G. Hulley, and T. Marwala. Image
classification using SVMs: One-Against-One vs
One-Against-All. Clinical Orthopaedics and Related
Table 2: Classification F1(%) results
Time series No. of Parameters 1-Nearest neighbor, SVM, polynomial Random forest
classes Chi-square distance kernel, degree = 2
CBF Wc=50, tc=5 99.35
ECG5000 3 Wc=10, tc=5 99.14 99.89 84.18
FordA 5 Wc=90, tc=5 77.91 86.89 81.92
Mallat 2 Wc=10, tc=5 70.41 89.96 97.08
ShapesAll 8 Wc=100, tc=5 98.78 99.96 62.19
UWaveGestureLibraryAll 60 Wc=50, tc=5 83.31 80.14 57.86
StarlightCurves 8 Wc=220, tc=5 25.53 80.64 96.89
Wafer 3 Wc=10, tc=5 91.47 97.56 99.04
F1 average 2 98.52 99.54 84.81
/ / 80.63 91.82
StuCoSReC Proceedings of the 2018 5th Student Computer Science Research Conference 58
Ljubljana, Slovenia, 9 October
on the following computer hardware:
Highest achieved classification accuracy on test datasets was
• Intel Core i7-6700K processor 99.96%, with average across all three classification models
• 16GB of DDR4 3200MHz memory being 85.75%. Feature extraction approach is appropriate
for use in various industry related problems and at analysis
Various open-source time series datasets [2] were used for of stock market, but medical use is questionable, because
testing and are described in Table 1. Each dataset contains achieved accuracy must be at highest level possible to ensure
time series of equal length and split in two classes or more. medical safety. Best such case are classification scores for
Testing was done using 5-fold cross-validation with F1 score time series ECG5000, where highest achieved F1 score is
as classification accuracy measurement for all classification 86.89%, much lower than satisfying for critical medical data.
algorithms, presented in Chapter 2.4. Dictionaries contain-
ing 2000 words were used. Parameters Wc and moving step Parallel computing can be used for extraction of segments
tc were choosen individually for every time series. The rea- and at defining time series feature vectors. Presented feature
son being is that their lengths differ and experimenting with extraction approach is appropriate for integration in real-
different parameter values was needed to reach best possible time systems and IoT devices, however training phase should
classification score. Classification results are presented in be done separately from working environment. Higher clas-
Table 2. sification accuracy could be achieved with use of multivariate
time series.
Table 1: Time series descriptions
5. REFERENCES
Time series Description
CBF Simulated time series [1] V. Asha, N. U. Bhajantri, and P. Nagabhushan.
ECG5000 ECG signal of a patient GLCM based Chi-square Histogram Distance for
FordA having a heart failure Automatic Detection of Defects on Patterned
Mallat Engine sounds Textures. International Journal of Computational
ShapesAll Simulated time series Vision and Robotics, 2(4):302–313, 2011.
Binary images contours
UWaveGestureLibraryAll distances from center [2] A. Bagnall, J. Lines, W. Vickers, and E. Keogh. The
Accelerometer data gene- UEA and UCR Time Series Classification Repository.
StarlighCurves rated during hand movement Available at www.timeseriesclassification.com.
Brightness of astronomical
Wafer objects through time [3] P.M. Bentley and J.T.E. McDonnell. Wavelet
Measurements recorded from transforms: an introduction. Electronics and
sensors during the processing Communication Engineering Journal, 6(4):175–186,
of silicon wafers 1994.
Highest average classification F1 score 91.82% was achieved [4] G. Biau. Analysis of a Random Forests Model. Journal
with SVM classification model, followed by random forest of Machine Learning Research, 13:1063–1095, 2012.
and 1-nearest neighbor using Chi-square distance measure.
Biggest difference in classification results can be seen at [5] Thomas H. Davenport. Big Data at Work. Harvard
UWaveGestureLibraryAll, where 1-NN classifier achieved F1 Business Review Press, 2014.
score of 25.53%, opposed to SVM’s score of 80.64%. F1
scores of all classification models are closest at classifying [6] F. Fang, H. Lu, and Y. Chen. Bag of Features
time series CBF, with a difference of only 0.75% between Tracking. International Conference on Pattern
them. Recognition, 2010(46):153–156, 2010.
[7] K. Fawagreh, M. Gaber, and E. Elyan. Random
forests: from early developments to recent
advancements. Systems Science and Control
Engineering, 2(1):602–609, 2014.
[8] A. Gidudu, G. Hulley, and T. Marwala. Image
classification using SVMs: One-Against-One vs
One-Against-All. Clinical Orthopaedics and Related
Table 2: Classification F1(%) results
Time series No. of Parameters 1-Nearest neighbor, SVM, polynomial Random forest
classes Chi-square distance kernel, degree = 2
CBF Wc=50, tc=5 99.35
ECG5000 3 Wc=10, tc=5 99.14 99.89 84.18
FordA 5 Wc=90, tc=5 77.91 86.89 81.92
Mallat 2 Wc=10, tc=5 70.41 89.96 97.08
ShapesAll 8 Wc=100, tc=5 98.78 99.96 62.19
UWaveGestureLibraryAll 60 Wc=50, tc=5 83.31 80.14 57.86
StarlightCurves 8 Wc=220, tc=5 25.53 80.64 96.89
Wafer 3 Wc=10, tc=5 91.47 97.56 99.04
F1 average 2 98.52 99.54 84.81
/ / 80.63 91.82
StuCoSReC Proceedings of the 2018 5th Student Computer Science Research Conference 58
Ljubljana, Slovenia, 9 October