Page 66 - Fister jr., Iztok, and Andrej Brodnik (eds.). StuCoSReC. Proceedings of the 2018 5th Student Computer Science Research Conference. Koper: University of Primorska Press, 2018
P. 66
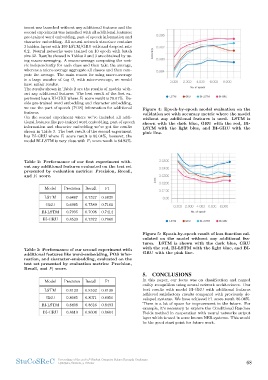
nt was launched without any additional features and the Figure 4: Epoch-by-epoch model evaluation on the
second experiment was launched with all additional features: validation set with accuracy metric where the model
pre-trained word embedding, part of speech information and without any additional features is used. LSTM is
character embedding. All neural network structure contains shown with the dark blue, GRU with the red, BI-
3 hidden layers with 100 LSTM/GRU cells and dropout rate LSTM with the light blue, and BI-GRU with the
0.2. Neural networks were trained on 10 epoch with batch pink line.
size 32. Results showed in Tables 2 and 3 are obtained by us-
ing macro-averaging. A macro-average computing the met-
ric independently for each class and then take the average,
whereas a micro-average aggregate all classes and then com-
pute the average. The main reason for using macro-average
is a large number of tag O, with micro-average, we would
have unfair results.
The results shown in Table 2 are the results of models with-
out any additional features. The best result of the first ex-
periment has a BI-GRU where F1 score result is 78.61%. Be-
side pre-trained word embedding and character embedding,
we use the part of speech (POS) information for additional
features.
On the second experiment where we’ve included all addi-
tional features like pre-trained word embedding, part of speech
information and character embedding we’ve got the results
shown in Table 3. The best result of the second experiment
has BI-GRU where F1 score result is 86.04%, however, the
model BI-LSTM is very close with F1 score result is 84.93%.
Table 2: Performance of our first experiment with-
out any additional features evaluated on the test set
presented by evaluation metrics: Precision, Recall,
and F1 score.
Model Precision Recall F1
LSTM 0.6487 0.7527 0.6821
GRU 0.6985 0.7589 0.7161
BI-LSTM 0.7995 0.7098 0.7414
BI-GRU 0.8529 0.7372 0.7861
Table 3: Performance of our second experiment with Figure 5: Epoch-by-epoch result of loss function cal-
additional features like word-embedding, POS infor- culated on the model without any additional fea-
mation, and character-embedding, evaluated on the tures. LSTM is shown with the dark blue, GRU
test set presented by evaluation metrics: Precision, with the red, BI-LSTM with the light blue, and BI-
Recall, and F1 score. GRU with the pink line.
Model Precision Recall F1 5. CONCLUSIONS
LSTM 0.8123 0.8162 0.8138 In this paper, our focus was on classification and named
GRU 0.8085 0.8071 0.8056 entity recognition using neural network architectures. Our
BI-LSTM 0.8408 0.8616 0.8493 best results with model BI-GRU with additional features
BI-GRU 0.8610 0.8604 0.8604 achieved satisfactory results compared with previously de-
veloped systems. We have achieved F1 score result 86.04%.
There is a lot of space for improvement in the future. For
example, it’s necessary to explore the Conditional Random
Fields method in cooperation with neural networks output
layer which is used in some known NER systems. This would
be the good start point for future work.
StuCoSReC Proceedings of the 2018 5th Student Computer Science Research Conference 68
Ljubljana, Slovenia, 9 October