Page 40 - S. Ličen, I. Karnjuš, & M. Prosen (Eds.). (2019). Women, migrations and health: Ensuring transcultural healthcare. Koper, University of Primorska Press.
P. 40
ž Lenarčič and Mateja Sedmak
Table 2 Foreign Women in Slovenia by Country of Citizenship in the Period 2011–2018
Country
States of former Yugoslavia n , , , , ,
European Union Member States . . . . .
Other countries n
Total , , , , ,
n . . . . .
n , , , , ,
. . . . .
, , , , ,
. . . . .
Notes Residents on 1 January. Based on data from Statistical Office of the Republic of Slovenia
(https://www.stat.si).
followed by Central Slovenia (7.5) and Litoral-Inner Karniola (6.5). At the
administrative level in relation to absolute numbers of foreign women, the
highest numbers of foreign women are in Ljubljana (10,502), Maribor (3,256),
Koper (2,128), Kranj (1,692), Celje (1,634) and Velenje (1,062). The highest per-
centages of foreign women in relation to whole population are seen in the
Coastal municipalities: Izola (4.9), Sežana (4.8), Koper (4.1).
Origins and Age Structure
Among all foreign immigrant women in Slovenia in the period 2011–2018, the
highest share had arrivals from the states of former Yugoslavia, followed by
European Union Member States and other countries. The available statistical
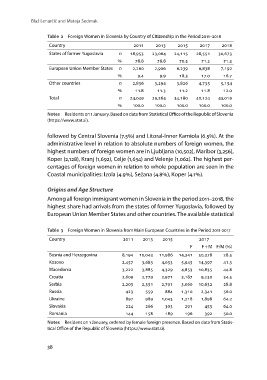
Table 3 Foreign Women in Slovenia from Main European Countries in the Period 2011-2017
Country
F F + M F/M ()
Bosnia and Herzegovina , , , , , .
Kosovo , , , , , .
Macedonia , , , , , .
Croatia , , , , .
Serbia , , , , , .
Russia , , .
Ukraine , , .
Slovakia , .
Romania , .
Notes Resident on 1 January, ordered by female foreign presence. Based on data from Statis-
tical Office of the Republic of Slovenia (https://www.stat.si).
38
Table 2 Foreign Women in Slovenia by Country of Citizenship in the Period 2011–2018
Country
States of former Yugoslavia n , , , , ,
European Union Member States . . . . .
Other countries n
Total , , , , ,
n . . . . .
n , , , , ,
. . . . .
, , , , ,
. . . . .
Notes Residents on 1 January. Based on data from Statistical Office of the Republic of Slovenia
(https://www.stat.si).
followed by Central Slovenia (7.5) and Litoral-Inner Karniola (6.5). At the
administrative level in relation to absolute numbers of foreign women, the
highest numbers of foreign women are in Ljubljana (10,502), Maribor (3,256),
Koper (2,128), Kranj (1,692), Celje (1,634) and Velenje (1,062). The highest per-
centages of foreign women in relation to whole population are seen in the
Coastal municipalities: Izola (4.9), Sežana (4.8), Koper (4.1).
Origins and Age Structure
Among all foreign immigrant women in Slovenia in the period 2011–2018, the
highest share had arrivals from the states of former Yugoslavia, followed by
European Union Member States and other countries. The available statistical
Table 3 Foreign Women in Slovenia from Main European Countries in the Period 2011-2017
Country
F F + M F/M ()
Bosnia and Herzegovina , , , , , .
Kosovo , , , , , .
Macedonia , , , , , .
Croatia , , , , .
Serbia , , , , , .
Russia , , .
Ukraine , , .
Slovakia , .
Romania , .
Notes Resident on 1 January, ordered by female foreign presence. Based on data from Statis-
tical Office of the Republic of Slovenia (https://www.stat.si).
38