Page 39 - S. Ličen, I. Karnjuš, & M. Prosen (Eds.). (2019). Women, migrations and health: Ensuring transcultural healthcare. Koper, University of Primorska Press.
P. 39
Reproductive Health of Migrant Women in Slovenia: State of the Art
area, when more than 70,000 refugees came and some of them settled per-
manently, and also from Kosovo. Like other EU Members States in the last
five-year period, Slovenia has also been challenged by migration flows due
to the conflicts in the Middle East and Africa. However, it still remains mostly
a transition country.
Percentages of Migrant Women
In the period 2011–2018 the percentage of foreigners in the overall Slovenian
population has increased by 1.8 (from 4.1 to 5.9); in absolute terms, from
84,854 to 121,875. In the same period, the number of foreign women increased
from 25,728 to 43,019. As a percentage of the female population, it has gone
from 2.4 in 2011 to 4.1 in 2018.
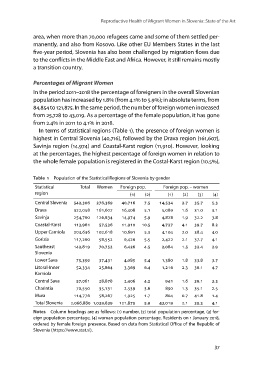
In terms of statistical regions (Table 1), the presence of foreign women is
highest in Central Slovenia (40,716), followed by the Drava region (161,607),
Savinja region (14,974) and Coastal-Karst region (11,910). However, looking
at the percentages, the highest percentage of foreign women in relation to
the whole female population is registered in the Costal-Karst region (10.5),
Table 1 Population of the Statistical Regions of Slovenia by gender
Statistical Total Women Foreign pop. Foreign pop. – women
region () () () () () ()
Central Slovenia , , , . , . . .
, . , . . .
Drava , , , . , . . .
, . , . . .
Savinja , , , . , . . .
. , . . .
Coastal-Karst , , , . , . . .
,
Upper Carniola , , . , . . .
, . , . . .
Gorizia , , ,
. . . .
Sautheast , , , . . . .
Slovenia , . . . .
, . , . . .
Lower Sava , , ,
Litoral-Inner , ,
Karniola
Central Sava , ,
Charintia , ,
Mura , ,
Total Slovenia ,, ,,
Notes Column headings are as follows: (1) number, (2) total population percentage, (3) for-
eign population percentage, (4) woman population percentage. Residents on 1 January 2018,
ordered by female foreign presence. Based on data from Statistical Office of the Republic of
Slovenia (https://www.stat.si).
37
area, when more than 70,000 refugees came and some of them settled per-
manently, and also from Kosovo. Like other EU Members States in the last
five-year period, Slovenia has also been challenged by migration flows due
to the conflicts in the Middle East and Africa. However, it still remains mostly
a transition country.
Percentages of Migrant Women
In the period 2011–2018 the percentage of foreigners in the overall Slovenian
population has increased by 1.8 (from 4.1 to 5.9); in absolute terms, from
84,854 to 121,875. In the same period, the number of foreign women increased
from 25,728 to 43,019. As a percentage of the female population, it has gone
from 2.4 in 2011 to 4.1 in 2018.
In terms of statistical regions (Table 1), the presence of foreign women is
highest in Central Slovenia (40,716), followed by the Drava region (161,607),
Savinja region (14,974) and Coastal-Karst region (11,910). However, looking
at the percentages, the highest percentage of foreign women in relation to
the whole female population is registered in the Costal-Karst region (10.5),
Table 1 Population of the Statistical Regions of Slovenia by gender
Statistical Total Women Foreign pop. Foreign pop. – women
region () () () () () ()
Central Slovenia , , , . , . . .
, . , . . .
Drava , , , . , . . .
, . , . . .
Savinja , , , . , . . .
. , . . .
Coastal-Karst , , , . , . . .
,
Upper Carniola , , . , . . .
, . , . . .
Gorizia , , ,
. . . .
Sautheast , , , . . . .
Slovenia , . . . .
, . , . . .
Lower Sava , , ,
Litoral-Inner , ,
Karniola
Central Sava , ,
Charintia , ,
Mura , ,
Total Slovenia ,, ,,
Notes Column headings are as follows: (1) number, (2) total population percentage, (3) for-
eign population percentage, (4) woman population percentage. Residents on 1 January 2018,
ordered by female foreign presence. Based on data from Statistical Office of the Republic of
Slovenia (https://www.stat.si).
37