Page 93 - Gričar, Sergej, Barbara Rodica and Štefan Bojnec, 2016. Sandwich Management. Koper: University of Primorska Press
P. 93
Projects’ Interdisciplinarity – Qualitative Analyses
of mathematical economies, statistical economies and mathematical sta-
tistics. Mathematic statistics use a lot of data from economy (in the trade).
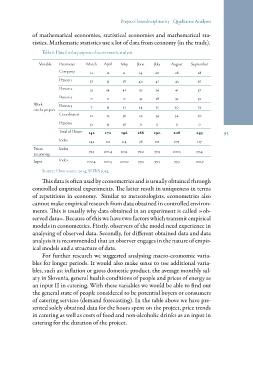
Table 6: Data for the purpose of econometric analysis.
Variable Parameter March April May June July August September
20 28 28
Company 11 12 11 14 41 43 36
34 41 37
Person 1 37 35 38 40 28 32 39
33 30 33
Person 2 33 34 42 39 34 34 70
0 0 0
Person 3 0 0 0 32 190 208 243
101 109 117
Work Person 4 7 33 33 34
99,9 100,5 99,4
on the project Coordinator
99,1 99,3 100,9
22 25 36 29
Person 5 32 33 36 0
Total of Hours 142 172 196 188 93
Index 142 121 114 96
Prices Index 99,3 100,4 101,1 99,2
in catering Index 100,4 100,3 100,0 99,3
Input
Source: Own source 2014; SORS 2014.
This data is often used by econometrics and is usually obtained through
controlled empirical experiments. The latter result in uniqueness in terms
of repetitions in economy. Similar to meteorologists, econometrics also
cannot make empirical research from data obtained in controlled environ-
ments. This is usually why data obtained in an experiment is called »ob-
served data«. Because of this we have two factors which transmit empirical
models in econometrics. Firstly, observers of the model need experience in
analysing of observed data. Secondly, for different obtained data and data
analysis it is recommended that an observer engages in the nature of empir-
ical models and a structure of date.
For further research we suggested analysing macro-ecomomic varia-
bles for longer periods. It would also make sense to use additional varia-
bles, such as: inflation or gross domestic product, the average monthly sal-
ary in Slovenia, general health conditions of people and prices of energy as
an input II in catering. With these variables we would be able to find out
the general state of people considered to be potential buyers or consumers
of catering services (demand forecasting). In the table above we have pre-
sented solely obtained data for the hours spent on the project, price trends
in catering as well as costs of food and non-alcoholic drinks as an input in
catering for the duration of the project.
of mathematical economies, statistical economies and mathematical sta-
tistics. Mathematic statistics use a lot of data from economy (in the trade).
Table 6: Data for the purpose of econometric analysis.
Variable Parameter March April May June July August September
20 28 28
Company 11 12 11 14 41 43 36
34 41 37
Person 1 37 35 38 40 28 32 39
33 30 33
Person 2 33 34 42 39 34 34 70
0 0 0
Person 3 0 0 0 32 190 208 243
101 109 117
Work Person 4 7 33 33 34
99,9 100,5 99,4
on the project Coordinator
99,1 99,3 100,9
22 25 36 29
Person 5 32 33 36 0
Total of Hours 142 172 196 188 93
Index 142 121 114 96
Prices Index 99,3 100,4 101,1 99,2
in catering Index 100,4 100,3 100,0 99,3
Input
Source: Own source 2014; SORS 2014.
This data is often used by econometrics and is usually obtained through
controlled empirical experiments. The latter result in uniqueness in terms
of repetitions in economy. Similar to meteorologists, econometrics also
cannot make empirical research from data obtained in controlled environ-
ments. This is usually why data obtained in an experiment is called »ob-
served data«. Because of this we have two factors which transmit empirical
models in econometrics. Firstly, observers of the model need experience in
analysing of observed data. Secondly, for different obtained data and data
analysis it is recommended that an observer engages in the nature of empir-
ical models and a structure of date.
For further research we suggested analysing macro-ecomomic varia-
bles for longer periods. It would also make sense to use additional varia-
bles, such as: inflation or gross domestic product, the average monthly sal-
ary in Slovenia, general health conditions of people and prices of energy as
an input II in catering. With these variables we would be able to find out
the general state of people considered to be potential buyers or consumers
of catering services (demand forecasting). In the table above we have pre-
sented solely obtained data for the hours spent on the project, price trends
in catering as well as costs of food and non-alcoholic drinks as an input in
catering for the duration of the project.