Page 95 - Gričar, Sergej, Barbara Rodica and Štefan Bojnec, 2016. Sandwich Management. Koper: University of Primorska Press
P. 95
jects’ Interdisciplinarity – Qualitative Analyses
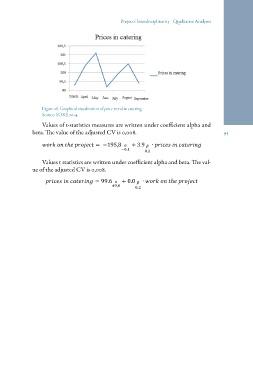
Figure 28: Graphical visualization of price trend in catering 95
Source: SORS, 2014.
Values of t-statistics measures are written under coefficient alpha and
beta. The value of the adjusted CV is 0,008.
Values t statistics are written under coefficient alpha and beta. The val-
ue of the adjusted CV is 0,008.