Page 90 - Gričar, Sergej, Barbara Rodica and Štefan Bojnec, 2016. Sandwich Management. Koper: University of Primorska Press
P. 90
Sandwich Management
dex. The latter is determined with the smallest value (minimum) and the
biggest value (maximum).
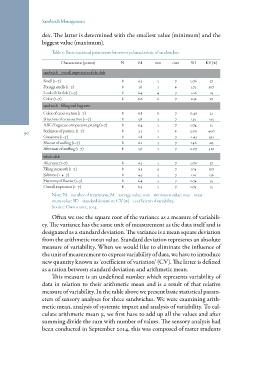
Table 5: Basic statistical parameters for sensory characteristic of sandwiches.
Characteristic (points) N M min max SD KV (%)
sandwich – overall impression of the dish
Smell (1–7) 8 6.5 5 7 0.76 57
Foreign smells (1–7) 8 1.8 1 6 1.75 307
Look of the dish (1–7) 8 6.4 4 7 1.06 113
Color (1–7) 8 6.6 6 7 0.52 27
sandwich – filling and baguette 7 0.46 21
7 1.39 193
Color of cross-section (1–7) 8 6.8 6 7 0.74 55
6 2.00 400
Structure of cross-section (1–7) 8 5.8 3 7 2.43 593
7 1.46 213
ABC/ baguette compaction, pitting (1–7) 8 6.4 5 7 2.07 427
90 Stickiness of pastries (1–7) 8 2.5 1
Grassiness (1–7) 8 2.8 1
Flavour of stuffing (1–7) 8 6.1 3
Aftertaste of stuffing (1–7) 8 5.6 1
whole dish 8 6.5 5 7 0.76 57
8 6.3 4 7 1.04 107
Aftertaste (1–7) 8 4.3 3 7 1.16 136
Filling in mouth (1–7) 8 6.4 5 7 0.74 55
Saltiness (1–4–7) 8 6.4 5 7 0.74 55
Harmony of flavour (1–7)
Overall impression (1–7)
Note: N – number of treatments; M – average value; min – minimum value; max – maxi-
mum value; SD – standard deviation; CV (%) – coefficient of variability.
Source: Own source, 2014.
Often we use the square root of the variance as a measure of variabili-
ty. The variance has the same unit of measurement as the data itself and is
designated as a standard deviation. The variance is a mean square deviation
from the arithmetic mean value. Standard deviation represents an absolute
measure of variability. When we would like to eliminate the influence of
the unit of measurement to express variability of data, we have to introduce
new quantity known as ‘coefficient of variation’ (CV). The latter is defined
as a ration between standard deviation and arithmetic mean.
This measure is an undefined number which represents variability of
data in relation to their arithmetic mean and is a result of that relative
measure of variability. In the table above we present basic statistical param-
eters of sensory analyses for three sandwiches. We were examining arith-
metic mean, analysis of systemic impact and analysis of variability. To cal-
culate arithmetic mean µ, we first have to add up all the values and after
summing divide the sum with number of values. The sensory analysis had
been conducted in September 2014, this was composed of taster students
dex. The latter is determined with the smallest value (minimum) and the
biggest value (maximum).
Table 5: Basic statistical parameters for sensory characteristic of sandwiches.
Characteristic (points) N M min max SD KV (%)
sandwich – overall impression of the dish
Smell (1–7) 8 6.5 5 7 0.76 57
Foreign smells (1–7) 8 1.8 1 6 1.75 307
Look of the dish (1–7) 8 6.4 4 7 1.06 113
Color (1–7) 8 6.6 6 7 0.52 27
sandwich – filling and baguette 7 0.46 21
7 1.39 193
Color of cross-section (1–7) 8 6.8 6 7 0.74 55
6 2.00 400
Structure of cross-section (1–7) 8 5.8 3 7 2.43 593
7 1.46 213
ABC/ baguette compaction, pitting (1–7) 8 6.4 5 7 2.07 427
90 Stickiness of pastries (1–7) 8 2.5 1
Grassiness (1–7) 8 2.8 1
Flavour of stuffing (1–7) 8 6.1 3
Aftertaste of stuffing (1–7) 8 5.6 1
whole dish 8 6.5 5 7 0.76 57
8 6.3 4 7 1.04 107
Aftertaste (1–7) 8 4.3 3 7 1.16 136
Filling in mouth (1–7) 8 6.4 5 7 0.74 55
Saltiness (1–4–7) 8 6.4 5 7 0.74 55
Harmony of flavour (1–7)
Overall impression (1–7)
Note: N – number of treatments; M – average value; min – minimum value; max – maxi-
mum value; SD – standard deviation; CV (%) – coefficient of variability.
Source: Own source, 2014.
Often we use the square root of the variance as a measure of variabili-
ty. The variance has the same unit of measurement as the data itself and is
designated as a standard deviation. The variance is a mean square deviation
from the arithmetic mean value. Standard deviation represents an absolute
measure of variability. When we would like to eliminate the influence of
the unit of measurement to express variability of data, we have to introduce
new quantity known as ‘coefficient of variation’ (CV). The latter is defined
as a ration between standard deviation and arithmetic mean.
This measure is an undefined number which represents variability of
data in relation to their arithmetic mean and is a result of that relative
measure of variability. In the table above we present basic statistical param-
eters of sensory analyses for three sandwiches. We were examining arith-
metic mean, analysis of systemic impact and analysis of variability. To cal-
culate arithmetic mean µ, we first have to add up all the values and after
summing divide the sum with number of values. The sensory analysis had
been conducted in September 2014, this was composed of taster students