Page 153 - Petelin, Ana, Nejc Šarabon, Boštjan Žvanut, eds. 2017. Zdravje delovno aktivne populacije ▪︎ Health of the Working-Age Population. Proceedings. Koper: Založba Univerze na Primorskem/University of Primorska Press
P. 153
ying the average values the arithmetic mean and standard deviation were
used. The correlation is done with the help of the Pearson and Sperman corre-
lation coefficient test.
Results
The study included 150 respondents, aged 20 years and over, and the average
age was 39.97 years (SD = 12.84). The youngest patient was 20 years old while
the oldest participant was 60 years old. The share of the female population in
this, as well as in the majority of similar studies were dominant (72%), which is
expected, when it comes to the profession. There was a significant difference in
terms of age and sex (χ2 = 17,987; p <0.001). More than half of respondents are
(66%) while the remaining 34% are not married.
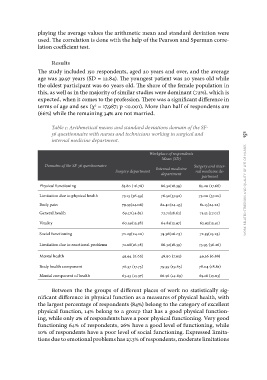
Table 1: Arithmetical means and standard deviations domain of the SF- work related stressors and quality of life of nurses 151
36 questionnaire with nurses and technicians working in surgical and
internal medicine department.
Workplace of respondents
Mean (SD)
Domains of the SF-36 questionnaire Surgery department Internal medicine Surgery and inter-
department nal medicine de-
Physical functioning
Limitation due to physical health partment
Body pain
General health 83.80 (16.78) 86.32(18.39) 85.20 (17.68)
Vitality
Social functioning 73.13 (36.49) 76.50(37.92) 75.00 (37.20)
Limitation due to emotional problems 79.55(24.06) 82.40(24.43) 81.13(24.22)
Mental health 69.17(14.83) 72.71(18.63) 71.13 (17.07)
Body health component
Mental component of health 60.59(13.58) 64.81(13.97) 62.93(13.91)
70.29(24.20) 74.36(26.03) 72.55(25.23)
71.08(16.78) 86.32(18.39) 73.93 (36.26)
49.94 (6.66) 48.90 (7.05) 49.36 (6.88)
76.37 (17.73) 79.39 (19.65) 78.04 (18.81)
63.43 (15.37) 66.56 (14.69) 65.16 (15.03)
Between the the groups of different places of work no statistically sig-
nificant difference in physical function as a measures of physical health, with
the largest percentage of respondents (84%) belong to the category of excellent
physical function, 14% belong to a group that has a good physical function-
ing, while only 2% of respondents have a poor physical functioning. Very good
functioning 64% of respondents, 26% have a good level of functioning, while
10% of respondents have a poor level of social functioning. Expressed limita-
tions due to emotional problems has 27.3% of respondents, moderate limitations
used. The correlation is done with the help of the Pearson and Sperman corre-
lation coefficient test.
Results
The study included 150 respondents, aged 20 years and over, and the average
age was 39.97 years (SD = 12.84). The youngest patient was 20 years old while
the oldest participant was 60 years old. The share of the female population in
this, as well as in the majority of similar studies were dominant (72%), which is
expected, when it comes to the profession. There was a significant difference in
terms of age and sex (χ2 = 17,987; p <0.001). More than half of respondents are
(66%) while the remaining 34% are not married.
Table 1: Arithmetical means and standard deviations domain of the SF- work related stressors and quality of life of nurses 151
36 questionnaire with nurses and technicians working in surgical and
internal medicine department.
Workplace of respondents
Mean (SD)
Domains of the SF-36 questionnaire Surgery department Internal medicine Surgery and inter-
department nal medicine de-
Physical functioning
Limitation due to physical health partment
Body pain
General health 83.80 (16.78) 86.32(18.39) 85.20 (17.68)
Vitality
Social functioning 73.13 (36.49) 76.50(37.92) 75.00 (37.20)
Limitation due to emotional problems 79.55(24.06) 82.40(24.43) 81.13(24.22)
Mental health 69.17(14.83) 72.71(18.63) 71.13 (17.07)
Body health component
Mental component of health 60.59(13.58) 64.81(13.97) 62.93(13.91)
70.29(24.20) 74.36(26.03) 72.55(25.23)
71.08(16.78) 86.32(18.39) 73.93 (36.26)
49.94 (6.66) 48.90 (7.05) 49.36 (6.88)
76.37 (17.73) 79.39 (19.65) 78.04 (18.81)
63.43 (15.37) 66.56 (14.69) 65.16 (15.03)
Between the the groups of different places of work no statistically sig-
nificant difference in physical function as a measures of physical health, with
the largest percentage of respondents (84%) belong to the category of excellent
physical function, 14% belong to a group that has a good physical function-
ing, while only 2% of respondents have a poor physical functioning. Very good
functioning 64% of respondents, 26% have a good level of functioning, while
10% of respondents have a poor level of social functioning. Expressed limita-
tions due to emotional problems has 27.3% of respondents, moderate limitations