Page 165 - Hojnik, Jana. 2017. In Persuit of Eco-innovation. Drivers and Consequences of Eco-innovation at Firm Level. Koper: University of Primorska Press
P. 165
Results
N Mean St. Dev. Skew St. Err. Kurt St. Err.
Skew Kurt
The government pro- 223 4.18 1.710 0.016 0.163 -0.960 0.324
motes environmental
protection.
The government pro- 3.78 1.727 0.275 0.163 -0.770 0.324
vides green public pro- 223
curement.
The government pro-
vides an opportunity to 223 4.02 1.594 0.092 0.163 -0.817 0.324
undertake environmen-
tal tenders/calls.
The government pro-
vides an opportunity to 223 3.93 1.638 0.171 0.163 -0.790 0.324
undertake environmen-
tal projects. 165
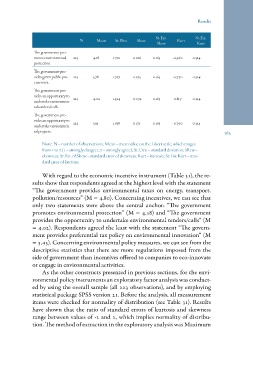
Note: N = number of observations; Mean = mean value on the Likert scale, which ranges
from 1 to 7 (1 = strongly disagree, 7 = strongly agree); St. Dev. = standard deviation; Skew =
skewness; St. Err. of Skew = standard error of skewness; Kurt = kurtosis; St. Err. Kurt = stan-
dard error of kurtosis.
With regard to the economic incentive instrument (Table 31), the re-
sults show that respondents agreed at the highest level with the statement
“The government provides environmental taxes on energy, transport,
pollution/resources” (M = 4.80). Concerning incentives, we can see that
only two statements were above the central anchor: “The government
promotes environmental protection” (M = 4.18) and “The government
provides the opportunity to undertake environmental tenders/calls” (M
= 4.02). Respondents agreed the least with the statement “The govern-
ment provides preferential tax policy on environmental innovation” (M
= 3.43). Concerning environmental policy measures, we can see from the
descriptive statistics that there are more regulations imposed from the
side of government than incentives offered to companies to eco-innovate
or engage in environmental activities.
As the other constructs presented in previous sections, for the envi-
ronmental policy instruments an exploratory factor analysis was conduct-
ed by using the overall sample (all 223 observations), and by employing
statistical package SPSS version 21. Before the analysis, all measurement
items were checked for normality of distribution (see Table 31). Results
have shown that the ratio of standard errors of kurtosis and skewness
range between values of -2 and 2, which implies normality of distribu-
tion. The method of extraction in the exploratory analysis was Maximum
N Mean St. Dev. Skew St. Err. Kurt St. Err.
Skew Kurt
The government pro- 223 4.18 1.710 0.016 0.163 -0.960 0.324
motes environmental
protection.
The government pro- 3.78 1.727 0.275 0.163 -0.770 0.324
vides green public pro- 223
curement.
The government pro-
vides an opportunity to 223 4.02 1.594 0.092 0.163 -0.817 0.324
undertake environmen-
tal tenders/calls.
The government pro-
vides an opportunity to 223 3.93 1.638 0.171 0.163 -0.790 0.324
undertake environmen-
tal projects. 165
Note: N = number of observations; Mean = mean value on the Likert scale, which ranges
from 1 to 7 (1 = strongly disagree, 7 = strongly agree); St. Dev. = standard deviation; Skew =
skewness; St. Err. of Skew = standard error of skewness; Kurt = kurtosis; St. Err. Kurt = stan-
dard error of kurtosis.
With regard to the economic incentive instrument (Table 31), the re-
sults show that respondents agreed at the highest level with the statement
“The government provides environmental taxes on energy, transport,
pollution/resources” (M = 4.80). Concerning incentives, we can see that
only two statements were above the central anchor: “The government
promotes environmental protection” (M = 4.18) and “The government
provides the opportunity to undertake environmental tenders/calls” (M
= 4.02). Respondents agreed the least with the statement “The govern-
ment provides preferential tax policy on environmental innovation” (M
= 3.43). Concerning environmental policy measures, we can see from the
descriptive statistics that there are more regulations imposed from the
side of government than incentives offered to companies to eco-innovate
or engage in environmental activities.
As the other constructs presented in previous sections, for the envi-
ronmental policy instruments an exploratory factor analysis was conduct-
ed by using the overall sample (all 223 observations), and by employing
statistical package SPSS version 21. Before the analysis, all measurement
items were checked for normality of distribution (see Table 31). Results
have shown that the ratio of standard errors of kurtosis and skewness
range between values of -2 and 2, which implies normality of distribu-
tion. The method of extraction in the exploratory analysis was Maximum