Page 169 - Hojnik, Jana. 2017. In Persuit of Eco-innovation. Drivers and Consequences of Eco-innovation at Firm Level. Koper: University of Primorska Press
P. 169
Results
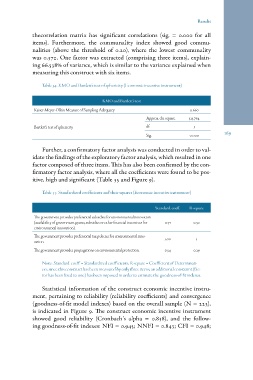
thecorrelation matrix has significant correlations (sig. = 0.000 for all
items). Furthermore, the communality index showed good commu-
nalities (above the threshold of 0.20), where the lowest communality
was 0.372. One factor was extracted (comprising three items), explain-
ing 66.538% of variance, which is similar to the variance explained when
measuring this construct with six items.
Table 34: KMO and Bartlett’s test of sphericity (Economic incentive instrument)
KMO and Bartlett’s test
Kaiser-Meyer-Olkin Measure of Sampling Adequacy 0.660
323.764
Approx. chi-square
3
Bartlett’s test of sphericity df 0.000
Sig. 169
Further, a confirmatory factor analysis was conducted in order to val-
idate the findings of the exploratory factor analysis, which resulted in one
factor composed of three items. This has also been confirmed by the con-
firmatory factor analysis, where all the coefficients were found to be pos-
itive, high and significant (Table 35 and Figure 9).
Table 35: Standardized coefficients and their squares (Economic incentive instrument)
Standard. coeff. R-square
0.50
The government provides preferential subsidies for environmental innovation 0.71
(availability of government grants, subsidies or other financial incentives for 1
environmental innovation). 0.29
The government provides preferential tax policies for environmental inno- 1.00
vation.
The government provides propagations on environmental protection. 0.54
Note: Standard. coeff. = Standardized coefficients; R-square = Coefficient of Determinati-
on; since this construct has been measured by only three items, an additional constraint (fac-
tor has been fixed to one) has been imposed in order to estimate the goodness-of-fit indexes.
Statistical information of the construct economic incentive instru-
ment, pertaining to reliability (reliability coefficients) and convergence
(goodness-of-fit model indexes) based on the overall sample (N = 223),
is indicated in Figure 9. The construct economic incentive instrument
showed good reliability (Cronbach’s alpha = 0.838), and the follow-
ing goodness-of-fit indexes: NFI = 0.945; NNFI = 0.843; CFI = 0.948;