Page 104 - Petelin, Ana, and Šarabon, Nejc. 2018. Eds. Zdravje starostnikov / Health of the Elderly. Znanstvena monografija / Proceedings. Koper: University of Primorska Press
P. 104
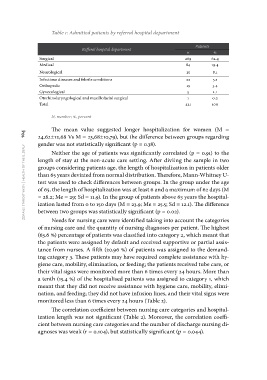
Table 1: Admitted patients by referral hospital department
Refferal hospital department Patients
Surgical n%
Medical 269 62.4
84 19.4
Neurological
35 8.1
Infectious diseases and febrile conditions
Orthopedic 22 5.1
Gynecological 15 3.4
Otorhinolaryngological and maxillofacial surgical 5 1.1
Total 1 0.2
431 100
zdravje starostnikov | health of the elderly 104 N, number; %, percent
The mean value suggested longer hospitalization for women (M =
24.62±12,68 Vs M = 23,68±10,79), but the difference between groups regarding
gender was not statistically significant (p = 0.38).
Neither the age of patients was significantly correlated (p = 0.91) to the
length of stay at the non-acute care setting. After diviing the sample in two
groups considering patients age, the length of hospitalization in patients older
than 65 years deviated from normal distribution. Therefore, Mann-Whitney U-
test was used to check differences between groups. In the group under the age
of 65, the length of hospitalization was at least 6 and a maximum of 62 days (M
= 28.2; Me = 29; Sd = 11.9). In the group of patients above 65 years the hospital-
ization lasted from 0 to 150 days (M = 23.9; Me = 25.5; Sd = 12.1). The difference
between two groups was statistically significant (p = 0.02).
Needs for nursing care were identified taking into account the categories
of nursing care and the quantity of nursing diagnoses per patient. The highest
(63.6 %) percentage of patients was classified into category 2, which meant that
the patients were assigned by default and received supportive or partial assis-
tance from nurses. A fifth (20.96 %) of patients was assigned to the demand-
ing category 3. These patients may have required complete assistance with hy-
giene care, mobility, elimination, or feeding; the patients received tube care, or
their vital signs were monitored more than 6 times every 24 hours. More than
a tenth (15.4 %) of the hospitalised patients was assigned to category 1, which
meant that they did not receive assistance with hygiene care, mobility, elimi-
nation, and feeding; they did not have infusion lines, and their vital signs were
monitored less than 6 times every 24 hours (Table 2).
The correlation coefficient between nursing care categories and hospital-
ization length was not significant (Table 2). Moreover, the correlation coeffi-
cient between nursing care categories and the number of discharge nursing di-
agnoses was weak (r = 0.104), but statistically significant (p = 0.044).