Page 105 - Petelin, Ana, and Šarabon, Nejc. 2018. Eds. Zdravje starostnikov / Health of the Elderly. Znanstvena monografija / Proceedings. Koper: University of Primorska Press
P. 105
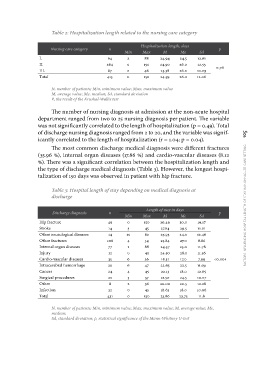
le 2: Hospitalization length related to the nursing care category
Nursing care category n Hospitalization length, days p
I. Min Max M Me Sd
II.
III. 64 2 88 24.94 24.5 12.61
Total
264 0 150 24.90 26.0 12.53 0.76
87 0 46 23.38 26.0 10.09
415 0 150 24.59 26.0 12.06
N, number of patients; Min, minimum value; Max, maximum value factors influencing hospital length of stay in non-acute care setting 105
M, average value; Me, median; Sd, standard deviation
P, the result of the Kruskal-Wallis test
The number of nursing diagnosis at admission at the non-acute hospital
department ranged from two to 25 nursing diagnosis per patient. The variable
was not significantly correlated to the length of hospitalization (p = 0.49). Total
of discharge nursing diagnosis ranged from 2 to 20, and the variable was signif-
icantly correlated to the length of hospitalization (r = 1.04; p = 0.04).
The most common discharge medical diagnosis were different fractures
(35.96 %), internal organ diseases (17.86 %) and cardio-vascular diseases (8.12
%). There was a significant correlation between the hospitalization length and
the type of discharge medical diagnosis (Table 3). However, the longest hospi-
talization of 150 days was observed in patient with hip fracture.
Table 3: Hospital length of stay depending on medical diagnosis at
discharge
Discharge diagnosis n Length of stay in days p
Hip fracture Min Max M Me Sd
Stroke
Other neurological diseases 49 0 150 30.49 30.0 19.17
Other fractures
Internal organ diseases 14 3 45 27.64 29.5 11.01
Injury
Cardio-vascular diseases 14 10 62 25.93 24.0 12.46
Intracerebral hemorrhage
Cancer 106 4 34 25.84 27.0 8.86
Surgical procedures
Other 77 1 88 24.57 25.0 11.78
Infection
Total 32 0 45 24.50 28.5 11.36
35 6 36 18.51 17.0 7.99 <0.001
20 6 47 22.65 22.5 11.69
24 4 45 22.13 18.0 12.65
20 3 37 21.50 24.5 10.07
8 2 36 20.00 20.5 12.28
32 0 43 18.63 18.0 10.06
431 0 150 23.86 23.75 11.8
N, number of patients; Min, minimum value; Max, maximum value; M, average value; Me,
median;
Sd, standard deviation; p, statistical significance of the Mann-Whitney U-test