Page 195 - Petelin, Ana, et al. 2019. Eds. Zdravje otrok in mladostnikov / Health of Children and Adolescents. Proceedings. Koper: University of Primorska Press
P. 195
understand the nutrition composition of food. This was also shown with do you know what you eat? 193
our online survey in 2016.
Online questionnaire was published on our website (www.zps.si) and
anonymously responded by 1063 consumers. Consumers were asked about
their purchasing decisions and to compare different products based on their
ingredients and nutrition value, challenging them with different information
presented (product’s front of pack picture, nutrition table with the list of ingre-
dients and traffic light profiling). Front of pack information together with nu-
trition table and list of ingredients are usually read by 71.9 % respondents. Buy-
ing decision is mostly influenced by product’s price, ingredients (35.4 %), origin
and place of manufacturing (29.3 %). Nutrition information is considered im-
portant by only 9.8 % of respondents. Consumers responded correctly when
guessing on the amount of sugar (low, medium, high) in 3 different cereal prod-
ucts presented only by picture, but for the amount of fats and saturated fatty
acids it was harder to guess. Even with the help of nutrition table they were not
able to correctly evaluate these values. When traffic light nutrition profile was
presented the responses were correct (ZPS, 2017).
Traffic light profiling
ZPS has developed a traffic light profiling scheme based on UK traffic light la-
bel developed by Food Standars Agency (FSA, 2007). It uses the same colours
and presentation, but the limits are adapted to Slovenian situation. Limits are
separated for food and drink, and stricter for the last, since sugar sweetened
beverages are one of children’s main sources of sugar (Fidler Mis et al., 2012).
Limits are presented in Table 1.
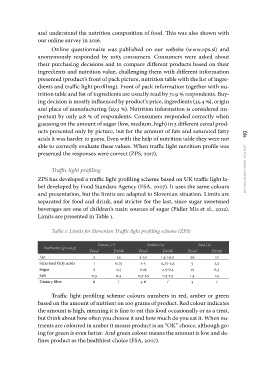
Table 1: Limits for Slovenian Traffic light profiling scheme (ZPS)
Nutrients (g/100 g) Green (✓) Amber (0) Red (x)
Fat Food Drink Food Drink Food Drink
Saturated fatty acids 3 1,5 3-20 1,5-10,0 20 10
Sugar
Salt 1 0,75 1-5 0,75-2,5 5 2,5
Dietary fiber
5 2,5 5-15 2,5-6,3 15 6,3
0,3 0,3 0,3-1,5 0,3-1,5 1,5 1,5
6/ 3-6 / 3/
Traffic light profiling scheme colours numbers in red, amber or green
based on the amount of nutrient on 100 grams of product. Red colour indicates
the amount is high, meaning it is fine to eat this food occasionally or as a treat,
but think about how often you choose it and how much do you eat it. When nu-
trients are coloured in amber it means product is an “OK” choice, although go-
ing for green is even better. And green colour means the amount is low and de-
fines product as the healthiest choice (FSA, 2007).
our online survey in 2016.
Online questionnaire was published on our website (www.zps.si) and
anonymously responded by 1063 consumers. Consumers were asked about
their purchasing decisions and to compare different products based on their
ingredients and nutrition value, challenging them with different information
presented (product’s front of pack picture, nutrition table with the list of ingre-
dients and traffic light profiling). Front of pack information together with nu-
trition table and list of ingredients are usually read by 71.9 % respondents. Buy-
ing decision is mostly influenced by product’s price, ingredients (35.4 %), origin
and place of manufacturing (29.3 %). Nutrition information is considered im-
portant by only 9.8 % of respondents. Consumers responded correctly when
guessing on the amount of sugar (low, medium, high) in 3 different cereal prod-
ucts presented only by picture, but for the amount of fats and saturated fatty
acids it was harder to guess. Even with the help of nutrition table they were not
able to correctly evaluate these values. When traffic light nutrition profile was
presented the responses were correct (ZPS, 2017).
Traffic light profiling
ZPS has developed a traffic light profiling scheme based on UK traffic light la-
bel developed by Food Standars Agency (FSA, 2007). It uses the same colours
and presentation, but the limits are adapted to Slovenian situation. Limits are
separated for food and drink, and stricter for the last, since sugar sweetened
beverages are one of children’s main sources of sugar (Fidler Mis et al., 2012).
Limits are presented in Table 1.
Table 1: Limits for Slovenian Traffic light profiling scheme (ZPS)
Nutrients (g/100 g) Green (✓) Amber (0) Red (x)
Fat Food Drink Food Drink Food Drink
Saturated fatty acids 3 1,5 3-20 1,5-10,0 20 10
Sugar
Salt 1 0,75 1-5 0,75-2,5 5 2,5
Dietary fiber
5 2,5 5-15 2,5-6,3 15 6,3
0,3 0,3 0,3-1,5 0,3-1,5 1,5 1,5
6/ 3-6 / 3/
Traffic light profiling scheme colours numbers in red, amber or green
based on the amount of nutrient on 100 grams of product. Red colour indicates
the amount is high, meaning it is fine to eat this food occasionally or as a treat,
but think about how often you choose it and how much do you eat it. When nu-
trients are coloured in amber it means product is an “OK” choice, although go-
ing for green is even better. And green colour means the amount is low and de-
fines product as the healthiest choice (FSA, 2007).