
Page 73 - Studia Universitatis Hereditati, vol 12(2) (2024)
P. 73
73
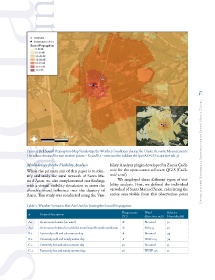
Figure 5: Bell Sound Propagation Map Simulating the Weather Conditions during the Onsite Acoustic Measurements. Unveiling the Historical Significance of Santa Maria D’àneu
The values obtained for two receiver points – R1 and R2 – were used to validate the SpreAD-GIS script (see tab. 3).
Methodology for the Visibility Analysis bility Analysis plugin developed by Zoran Čučk-
While the primary aim of this paper is to iden- ović for the open-source software QGIS (Čučk-
tify and study the aural network of Santa Ma- ović 2016).
ria d’Àneu, we also complemented our findings We employed three different types of visi-
with a virtual visibility simulation to assess the bility analysis. First, we defined the individual
church’s visual influence over the deanery of viewshed of Santa Maria d’Àneu, calculating the
Àneu. This study was conducted using the Visi- entire area visible from this observation point
Table 4. Weather Scenarios that Are Used in Testing the Sound Propagation
Temperature Wind Relative
# General description
(*C) (direction, m/s) Humidity (%)
A.1. As measured onsite (no wind) 18 No wind 30
A.2. As measured onsite, but with the most favorable wind conditions 18 SSE 3.75 30
B.1. Extremely cold and calm winter day -8 No wind 74
B.2. Extremely cold and windy winter day -8 NNE 6.25 74
C.1. Extremely hot and calm summer day 36 No wind 53
C.2. Extremely hot and windy summer day 36 WSW 3.75 53