
Page 71 - Studia Universitatis Hereditati, vol 12(2) (2024)
P. 71
71
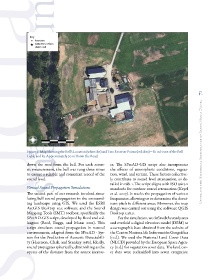
Figure 4: Map Showing the Bell’s Location (white dot) and Two Receiver Points (red dots)—R1 in Front of the Bell Unveiling the Historical Significance of Santa Maria D’àneu
Gable and R2 Approximately 70 m Down the Road.
down the road from the bell. For each acous- es. The SPreAD-GIS script also incorporates
tic measurement, the bell was rung three times the effects of atmospheric conditions, vegeta-
to ensure a reliable and consistent record of the tion, wind, and terrain. These factors collective-
sound level. ly contribute to sound level attenuation, as de-
tailed in tab. 1. The script aligns with ISO 9613-2
Virtual Sound Propagation Simulations standards for outdoor sound attenuation (Keyel
The second part of our research involved simu- et al. 2017). It tracks the propagation of various
lating bell sound propagation in the surround- frequencies, allowing us to determine the domi-
ing landscape using GIS. We used the ESRI nant pitch in different areas. Moreover, the map
ArcGIS Desktop 10.5 software and the Sound design was carried out using the software QGIS
Mapping Tools (SMT) toolbox, specifically the Desktop 3.38.0.
SPreAD-GIS script, developed by Reed and col- For the simulation, we defined the study area
leagues (Reed, Boggs, and Mann 2012). This and overlaid a digital elevation model (DEM) as
script simulates sound propagation in natural a cartographic base obtained from the website of
environments, adapted from the SPreAD - Sys- the Centro Nacional de Información Geográfica
tem for the Prediction of Acoustic Detectabili- (n.d.). We used the National Land Cover Data
ty (Harrison, Clark, and Stankey 1980). Ideally, (NLCD) provided by the European Space Agen-
sound propagates spherically, diminishing as the cy (n.d.) for vegetation cover data. The land cov-
square of the distance from the source increas- er data were reclassified into seven categories: