Page 42 - Fister jr., Iztok, and Andrej Brodnik (eds.). StuCoSReC. Proceedings of the 2016 3rd Student Computer Science Research Conference. Koper: University of Primorska Press, 2016
P. 42
scheme of velocity indicator consists of three mutu- report is parsed. To get proper weather report from web-
ally connected points. Connections create so-called polygon, site it is also necessary to locate closest weather station to
which has to be properly positioned and rotated to express activity position, what is still under research.
wanted velocity. Position can be fixed, due to fixed color
arc in primary figure, but rotation is a matter of two read Meanwhile, weather condition figures are drawn in advance,
values, written in personal dataset - expected minimum and so only compositing of them to the right place is necessary to
maximum value. Those extend the velocity range, e.g. 25 expose the weather conditions. If sunny weather is reported,
km/h as the lowest velocity and 45 km/h as the highest ve- only sun is exposed and opposingly, cloudy weather is seen
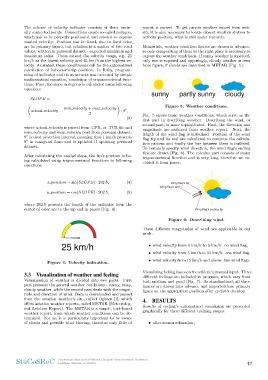
locity. As stated, those conditionals call for the automatized from figure, if clouds are described in METAR (Fig. 5):
calculation of indicator’s tip position. In Ruby, program-
ming of indicator and its movement was executed by simple Figure 5: Weather conditions.
mathematical equation, consisting of trigonometrical func-
tions. First, the slope in degrees is calculated using following Fig. 5 shows basic weather conditions, which serve as the
equation: first part in describing weather. Describing the wind, or
second part, is more sophisticated. First, the direction and
SLOP E = magnitude are gathered from weather report. Next, the
length of the wind flag is initialized. Position of the wind
actual velocity − min velocity + max velocity · 9◦, flag tip and its end are calculated to continue the calcula-
2 tion process and finally the line between them is outlined.
(3) To certainly specify wind direction, the wind flag’s ending
tips are drawn (Fig. 6). The calculus part consists of many
where actual velocity is parsed from .GPX, or .TCX file and trigonometrical function and is very long, therefore we ex-
min velocity and max velocity read from personal dataset. cluded it from paper.
9◦ is used as section interval, meaning that 1 km/h presents
9◦ in inaugural form and is updated if updating personal
dataset.
After calculating the needed slope, the tip’s position is be-
ing calculated using trigonometrical functions in following
equations:
x position = sin(SLOP E) · 202.5, (4) Wing flag’s tip
y position = cos(SLOP E) · 202.5, (5) Wing flag’s end
where 202.5 presents the length of the indicator from the Wing flag’s ending tip
center of color arc to the tip end in pixels (Fig. 4).
Figure 6: Describing wind.
Figure 4: Velocity indication.
Three different magnitudes of wind are applicable in our
3.3 Visualization of weather and feeling work:
Visualization of weather is divided into two parts. First • wind velocity from 0 km/h to 5 km/h: no wind flag,
part presents the general weather conditions - sunny, rainy, • wind velocity from 5 km/h to 15 km/h: one wind flag,
cloudy weather, while the second part deals with the magni- • wind velocity from 15 km/h and above: two wind flags.
tude and direction of wind. Data is downloaded and parsed
from the aviation weather’s site, called Ogimet [1], which Visualizing feeling bases on the athlete’s manual input. Three
offers aviation weather reports, called METAR (Meteorolog- different feelings are included in program, which vary from
ical Aviation Report). The METAR is a simple, text-based bad, medium and good (Fig. 7). As standardized, all three
weather report, from which weather conditions can be de- figures are drawn into advance and imported into primary
termined. For us, it is particularly important to be aware figure on the appropriate position after cyclist’s decision.
of clouds and possible wind blowing, therefore only little of
4. RESULTS
Results of cycling’s automatized visualizing are presented
graphically for three different training stages:
• after-season relaxation,
StuCoSReC Proceedings of the 2016 3rd Student Computer Science Research Conference 42
Ljubljana, Slovenia, 12 October
ally connected points. Connections create so-called polygon, site it is also necessary to locate closest weather station to
which has to be properly positioned and rotated to express activity position, what is still under research.
wanted velocity. Position can be fixed, due to fixed color
arc in primary figure, but rotation is a matter of two read Meanwhile, weather condition figures are drawn in advance,
values, written in personal dataset - expected minimum and so only compositing of them to the right place is necessary to
maximum value. Those extend the velocity range, e.g. 25 expose the weather conditions. If sunny weather is reported,
km/h as the lowest velocity and 45 km/h as the highest ve- only sun is exposed and opposingly, cloudy weather is seen
locity. As stated, those conditionals call for the automatized from figure, if clouds are described in METAR (Fig. 5):
calculation of indicator’s tip position. In Ruby, program-
ming of indicator and its movement was executed by simple Figure 5: Weather conditions.
mathematical equation, consisting of trigonometrical func-
tions. First, the slope in degrees is calculated using following Fig. 5 shows basic weather conditions, which serve as the
equation: first part in describing weather. Describing the wind, or
second part, is more sophisticated. First, the direction and
SLOP E = magnitude are gathered from weather report. Next, the
length of the wind flag is initialized. Position of the wind
actual velocity − min velocity + max velocity · 9◦, flag tip and its end are calculated to continue the calcula-
2 tion process and finally the line between them is outlined.
(3) To certainly specify wind direction, the wind flag’s ending
tips are drawn (Fig. 6). The calculus part consists of many
where actual velocity is parsed from .GPX, or .TCX file and trigonometrical function and is very long, therefore we ex-
min velocity and max velocity read from personal dataset. cluded it from paper.
9◦ is used as section interval, meaning that 1 km/h presents
9◦ in inaugural form and is updated if updating personal
dataset.
After calculating the needed slope, the tip’s position is be-
ing calculated using trigonometrical functions in following
equations:
x position = sin(SLOP E) · 202.5, (4) Wing flag’s tip
y position = cos(SLOP E) · 202.5, (5) Wing flag’s end
where 202.5 presents the length of the indicator from the Wing flag’s ending tip
center of color arc to the tip end in pixels (Fig. 4).
Figure 6: Describing wind.
Figure 4: Velocity indication.
Three different magnitudes of wind are applicable in our
3.3 Visualization of weather and feeling work:
Visualization of weather is divided into two parts. First • wind velocity from 0 km/h to 5 km/h: no wind flag,
part presents the general weather conditions - sunny, rainy, • wind velocity from 5 km/h to 15 km/h: one wind flag,
cloudy weather, while the second part deals with the magni- • wind velocity from 15 km/h and above: two wind flags.
tude and direction of wind. Data is downloaded and parsed
from the aviation weather’s site, called Ogimet [1], which Visualizing feeling bases on the athlete’s manual input. Three
offers aviation weather reports, called METAR (Meteorolog- different feelings are included in program, which vary from
ical Aviation Report). The METAR is a simple, text-based bad, medium and good (Fig. 7). As standardized, all three
weather report, from which weather conditions can be de- figures are drawn into advance and imported into primary
termined. For us, it is particularly important to be aware figure on the appropriate position after cyclist’s decision.
of clouds and possible wind blowing, therefore only little of
4. RESULTS
Results of cycling’s automatized visualizing are presented
graphically for three different training stages:
• after-season relaxation,
StuCoSReC Proceedings of the 2016 3rd Student Computer Science Research Conference 42
Ljubljana, Slovenia, 12 October