Page 44 - Fister jr., Iztok, and Andrej Brodnik (eds.). StuCoSReC. Proceedings of the 2016 3rd Student Computer Science Research Conference. Koper: University of Primorska Press, 2016
P. 44
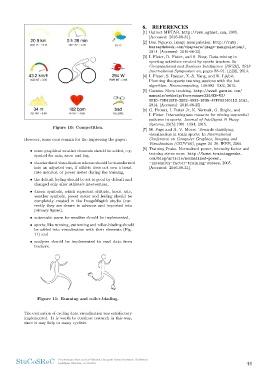
Figure 10: Competition. 6. REFERENCES
However, some cues remain for the improving the paper: [1] Ogimet METAR. http://www.ogimet.com, 2005.
[Accessed: 2016-08-31].
• some graphical weather elements should be added, e.g.
symbol for rain, snow and fog, [2] Dan Nguyen. Image manipulation. http://ruby.
bastardsbook.com/chapters/image-manipulation/,
• standardized visualization scheme should be transformed 2011. [Accessed: 2016-08-25].
into an adjusted one, if athlete does not own a heart
rate monitor, or power meter during the training, [3] I. Fister, D. Fister, and S. Fong. Data mining in
sporting activities created by sports trackers. In
• the default feeling should be set to good by default and Computational and Business Intelligence (ISCBI), 2013
changed only after athlete’s intervention, International Symposium on, pages 88–91. IEEE, 2013.
• drawn symbols, which represent altitude, heart rate, [4] I. Fister, S. Rauter, X.-S. Yang, and K. Ljubiˇc.
weather symbols, power meter and feeling should be Planning the sports training sessions with the bat
completely created in the ImageMagick studio (cur- algorithm. Neurocomputing, 149:993–1002, 2015.
rently they are drawn in advance and imported into
primary figure), [5] Garmin. Sleep tracking. http://www8.garmin.com/
manuals/webhelp/forerunner230/EN-US/
• automatic parse for weather should be implemented, GUID-70D41BFB-2BB2-4933-BF95-47FF63140112.html,
2014. [Accessed: 2016-08-25].
• sports, like running, swimming and roller-blading should
be added into visualization with their elements (Fig. [6] G. Hrovat, I. Fister Jr, K. Yermak, G. Stiglic, and
11) and I. Fister. Interestingness measure for mining sequential
patterns in sports. Journal of Intelligent & Fuzzy
• analyser should be implemented to read data from Systems, 29(5):1981–1994, 2015.
trackers.
[7] M. Page and A. V. Moere. Towards classifying
visualization in team sports. In International
Conference on Computer Graphics, Imaging and
Visualisation (CGIV’06), pages 24–29. IEEE, 2006.
[8] Training Peaks. Normalized power, intensity factor and
training stress score. http://home.trainingpeaks.
com/blog/article/normalized-power,
-intensity-factor-training-stress, 2005.
[Accessed: 2016-08-31].
Figure 11: Running and roller-blading. 44
The evaluation of cycling data visualization was satisfactory
implemented. It is worth to continue research in this way,
since it may help to many cyclists.
StuCoSReC Proceedings of the 2016 3rd Student Computer Science Research Conference
Ljubljana, Slovenia, 12 October