Page 40 - Fister jr., Iztok, and Andrej Brodnik (eds.). StuCoSReC. Proceedings of the 2016 3rd Student Computer Science Research Conference. Koper: University of Primorska Press, 2016
P. 40
• power. Distance Duration Weather
First six properties are recorded by tracker itself when wear- 200 km 5 h 15 min
ing or carrying during the activity, while least two are pro-
vided by wearing accessories. Heart rate monitor and power Velocity
meter crank are today’s classic equipment for cyclists and
are usually being used during the training. Data is com- 38 km/h 204 W
monly recorded every second into special .GPX or .TCX
dataset. This means that many useful information (e.g., Altitude
different graphs, coefficients, average values, fatigue predic-
tion, feeling and performance evaluation) can be extracted Power
from the activity datasets when interpolating data through
time. Tracker analysers usually compete against each other 3400 m 162 bpm good
to provide most data for athletes. Therefore, more and more
information are accessible when updating the tracker (ex- Heart rate Feeling
tracting data is still in research).
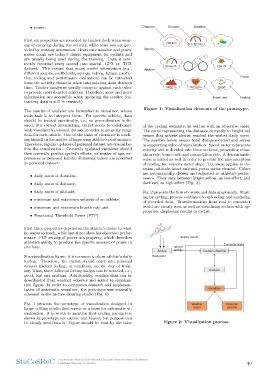
Figure 1: Visualization elements of the prototype.
The results of analyser are forwarded to visualizer, whose
main task is to interpret them. For specific athlete, data of the cycling elements, as well as with an objective value.
should be treated specifically, i.e., no generalization is de- The curve representing the distance currently in bright red
sired. For correct interpreting, cyclist needs to collaborate means that athlete almost reached the wished daily norm.
with visualizer’s personal dataset in order to properly range The number below means total distance cycled and serves
data for each athlete. One of the tasks of visualizer is teach- as supporting value of visualization. Speed meter represents
ing himself in the matter of improving athlete’s performance. velocity and is divided into three sections, presenting relax-
Therefore, regular updates of personal dataset are crucial be- ation ride, tempo ride and competition ride. A deterministic
fore the visualization. Correctly updated visualizer should value is added as well in order to prevent the misconception
then correctly predict cyclist’s efforts, no matter of age, ex- of reading the velocity meter slope. The same applies to du-
periences or personal habits. Following values are specified ration, altitude, heart rate and power meter element. Colors
in personal dataset: are automatically chosen and adjusted to athlete’s perfor-
mance. They vary between bright yellow, as low-effort, and
• daily norm of duration, dark red, as high-effort (Fig. 3).
• daily norm of distance, Fig. 2 presents the flow of events and data graphically. Start-
ing by cycling, process continues to uploading and analysing
• daily norm of altitude, of recorded data. Transformations from real to computer
world are clearly seen as well as visualizing section with ap-
• minimum and maximum velocity of an athlete, propriate displaying results to cyclist.
• minimum and maximum hearth rate and display results
• Functional Threshold Power (FTP). Athlete upload Computer world
Real world activity Tracker’s WebSite
First three properties depend on the athlete’s desire to what
he wants to reach, while last three show his objective perfor- Analyzer
mance. FTP setting of power is a property, which describes
athlete’s ability to produce the specific amount of power in Visualizer
one hour.
Weather Personal
For visualization figure, it is common to show athlete’s daily report data file
feeling. Therefore, the cyclist should enter into personal
dataset his/her feeling, or condition, on the day of train- Figure 2: Visualization process.
ing. Thus, three different feeling badges can be selected, i.e.,
good, bad and medium. Additionally, weather data can be
downloaded from weather websites and added to visualiza-
tion figure. In order to commence research and implemen-
tation of automatic visualizer, the prototype was manually
schemed in the picture drawing studio (Fig. 1).
Fig. 1 presents the prototype of visualization designed in
figure editing studio that serves as a basis for automatic vi-
sualization. It is worth to mention that cycling parameters
shown in prototype are untrue and biased, but purpose can
be clearly seen from it. Figure should be read by the color
StuCoSReC Proceedings of the 2016 3rd Student Computer Science Research Conference 40
Ljubljana, Slovenia, 12 October
First six properties are recorded by tracker itself when wear- 200 km 5 h 15 min
ing or carrying during the activity, while least two are pro-
vided by wearing accessories. Heart rate monitor and power Velocity
meter crank are today’s classic equipment for cyclists and
are usually being used during the training. Data is com- 38 km/h 204 W
monly recorded every second into special .GPX or .TCX
dataset. This means that many useful information (e.g., Altitude
different graphs, coefficients, average values, fatigue predic-
tion, feeling and performance evaluation) can be extracted Power
from the activity datasets when interpolating data through
time. Tracker analysers usually compete against each other 3400 m 162 bpm good
to provide most data for athletes. Therefore, more and more
information are accessible when updating the tracker (ex- Heart rate Feeling
tracting data is still in research).
Figure 1: Visualization elements of the prototype.
The results of analyser are forwarded to visualizer, whose
main task is to interpret them. For specific athlete, data of the cycling elements, as well as with an objective value.
should be treated specifically, i.e., no generalization is de- The curve representing the distance currently in bright red
sired. For correct interpreting, cyclist needs to collaborate means that athlete almost reached the wished daily norm.
with visualizer’s personal dataset in order to properly range The number below means total distance cycled and serves
data for each athlete. One of the tasks of visualizer is teach- as supporting value of visualization. Speed meter represents
ing himself in the matter of improving athlete’s performance. velocity and is divided into three sections, presenting relax-
Therefore, regular updates of personal dataset are crucial be- ation ride, tempo ride and competition ride. A deterministic
fore the visualization. Correctly updated visualizer should value is added as well in order to prevent the misconception
then correctly predict cyclist’s efforts, no matter of age, ex- of reading the velocity meter slope. The same applies to du-
periences or personal habits. Following values are specified ration, altitude, heart rate and power meter element. Colors
in personal dataset: are automatically chosen and adjusted to athlete’s perfor-
mance. They vary between bright yellow, as low-effort, and
• daily norm of duration, dark red, as high-effort (Fig. 3).
• daily norm of distance, Fig. 2 presents the flow of events and data graphically. Start-
ing by cycling, process continues to uploading and analysing
• daily norm of altitude, of recorded data. Transformations from real to computer
world are clearly seen as well as visualizing section with ap-
• minimum and maximum velocity of an athlete, propriate displaying results to cyclist.
• minimum and maximum hearth rate and display results
• Functional Threshold Power (FTP). Athlete upload Computer world
Real world activity Tracker’s WebSite
First three properties depend on the athlete’s desire to what
he wants to reach, while last three show his objective perfor- Analyzer
mance. FTP setting of power is a property, which describes
athlete’s ability to produce the specific amount of power in Visualizer
one hour.
Weather Personal
For visualization figure, it is common to show athlete’s daily report data file
feeling. Therefore, the cyclist should enter into personal
dataset his/her feeling, or condition, on the day of train- Figure 2: Visualization process.
ing. Thus, three different feeling badges can be selected, i.e.,
good, bad and medium. Additionally, weather data can be
downloaded from weather websites and added to visualiza-
tion figure. In order to commence research and implemen-
tation of automatic visualizer, the prototype was manually
schemed in the picture drawing studio (Fig. 1).
Fig. 1 presents the prototype of visualization designed in
figure editing studio that serves as a basis for automatic vi-
sualization. It is worth to mention that cycling parameters
shown in prototype are untrue and biased, but purpose can
be clearly seen from it. Figure should be read by the color
StuCoSReC Proceedings of the 2016 3rd Student Computer Science Research Conference 40
Ljubljana, Slovenia, 12 October