Page 175 - Hojnik, Jana. 2017. In Persuit of Eco-innovation. Drivers and Consequences of Eco-innovation at Firm Level. Koper: University of Primorska Press
P. 175
Results 175
this case investigated competitive intensity and competitive pressure in-
dividually. Before the analysis, all measurement items were checked for
normality of distribution (see Table 39). Results have shown that the ra-
tio of standard errors of kurtosis and skewness range between values of
-2 and 2, which implies normality of distribution. The method of extrac-
tion in the exploratory factor analysis was Maximum Likelihood Meth-
od, while the selected rotation was Direct Oblimin rotation.
As in the previous analyses, the appropriateness of factor analysis was
determined by examining the correlation matrix of competitive intensity
items. The existence of sufficient correlations (the Bartlett’s test of sphe-
ricity) and the Kaiser-Meyer-Olkin measure of sampling adequacy high-
er than 0.50 are critical issues. The Bartlett’s test of sphericity showed that
the correlation matrix has significant correlations (p < 0.05). Further-
more, the Kaiser-Meyer-Olkin measure of sampling adequacy was 0.633.
The number of expected and extracted factors for the construct com-
petitive intensity was one, explaining 36.733% of variance. After consider-
ation of each item’s communality index and its contribution, we retained
all the items (the lowest communality after extraction was 0.274).
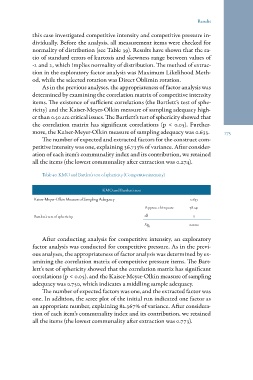
Table 40: KMO and Bartlett’s test of sphericity (Competitive intensity)
KMO and Bartlett’s test
Kaiser-Meyer-Olkin Measure of Sampling Adequacy 0.633
78.141
Approx. chi-square
3
Bartlett’s test of sphericity df 0.000
Sig.
After conducting analysis for competitive intensity, an exploratory
factor analysis was conducted for competitive pressure. As in the previ-
ous analyses, the appropriateness of factor analysis was determined by ex-
amining the correlation matrix of competitive pressure items. The Bart-
lett’s test of sphericity showed that the correlation matrix has significant
correlations (p < 0.05), and the Kaiser-Meyer-Olkin measure of sampling
adequacy was 0.750, which indicates a middling sample adequacy.
The number of expected factors was one, and the extracted factor was
one. In addition, the scree plot of the initial run indicated one factor as
an appropriate number, explaining 82.367% of variance. After considera-
tion of each item’s communality index and its contribution, we retained
all the items (the lowest communality after extraction was 0.773).
this case investigated competitive intensity and competitive pressure in-
dividually. Before the analysis, all measurement items were checked for
normality of distribution (see Table 39). Results have shown that the ra-
tio of standard errors of kurtosis and skewness range between values of
-2 and 2, which implies normality of distribution. The method of extrac-
tion in the exploratory factor analysis was Maximum Likelihood Meth-
od, while the selected rotation was Direct Oblimin rotation.
As in the previous analyses, the appropriateness of factor analysis was
determined by examining the correlation matrix of competitive intensity
items. The existence of sufficient correlations (the Bartlett’s test of sphe-
ricity) and the Kaiser-Meyer-Olkin measure of sampling adequacy high-
er than 0.50 are critical issues. The Bartlett’s test of sphericity showed that
the correlation matrix has significant correlations (p < 0.05). Further-
more, the Kaiser-Meyer-Olkin measure of sampling adequacy was 0.633.
The number of expected and extracted factors for the construct com-
petitive intensity was one, explaining 36.733% of variance. After consider-
ation of each item’s communality index and its contribution, we retained
all the items (the lowest communality after extraction was 0.274).
Table 40: KMO and Bartlett’s test of sphericity (Competitive intensity)
KMO and Bartlett’s test
Kaiser-Meyer-Olkin Measure of Sampling Adequacy 0.633
78.141
Approx. chi-square
3
Bartlett’s test of sphericity df 0.000
Sig.
After conducting analysis for competitive intensity, an exploratory
factor analysis was conducted for competitive pressure. As in the previ-
ous analyses, the appropriateness of factor analysis was determined by ex-
amining the correlation matrix of competitive pressure items. The Bart-
lett’s test of sphericity showed that the correlation matrix has significant
correlations (p < 0.05), and the Kaiser-Meyer-Olkin measure of sampling
adequacy was 0.750, which indicates a middling sample adequacy.
The number of expected factors was one, and the extracted factor was
one. In addition, the scree plot of the initial run indicated one factor as
an appropriate number, explaining 82.367% of variance. After considera-
tion of each item’s communality index and its contribution, we retained
all the items (the lowest communality after extraction was 0.773).