Page 180 - Hojnik, Jana. 2017. In Persuit of Eco-innovation. Drivers and Consequences of Eco-innovation at Firm Level. Koper: University of Primorska Press
P. 180
In Pursuit of Eco-innovation
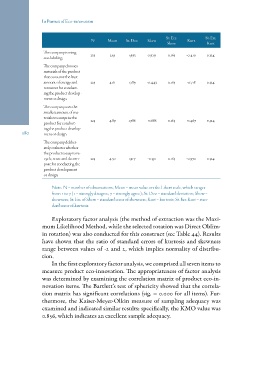
N Mean St. Dev. Skew St. Err. Kurt St. Err.
Skew Kurt
The company is using 223 2.59 1.993 0.979 0.163 -0.410 0.324
eco-labeling.
The company chooses 223 4.61 1.789 -0.443 0.163 -0.718 0.324
materials of the product
that consume the least
amount of energy and
resources for conduct-
ing the product develop-
ment or design.
The company uses the
smallest amount of ma-
terials to comprise the 223 4.89 1.786 -0.686 0.163 -0.467 0.324
product for conduct-
180 ing the product develop-
ment or design.
The company deliber- 223 4.50 1.917 -0.391 0.163 -0.972 0.324
ately evaluates whether
the product is easy to re-
cycle, reuse and decom-
pose for conducting the
product development
or design.
Note: N = number of observations; Mean = mean value on the Likert scale, which ranges
from 1 to 7 (1 = strongly disagree, 7 = strongly agree); St. Dev. = standard deviation; Skew =
skewness; St. Err. of Skew = standard error of skewness; Kurt = kurtosis; St. Err. Kurt = stan-
dard error of kurtosis.
Exploratory factor analysis (the method of extraction was the Maxi-
mum Likelihood Method, while the selected rotation was Direct Oblim-
in rotation) was also conducted for this construct (see Table 44). Results
have shown that the ratio of standard errors of kurtosis and skewness
range between values of -2 and 2, which implies normality of distribu-
tion.
In the first exploratory factor analysis, we comprised all seven items to
measure product eco-innovation. The appropriateness of factor analysis
was determined by examining the correlation matrix of product eco-in-
novation items. The Bartlett’s test of sphericity showed that the correla-
tion matrix has significant correlations (sig. = 0.000 for all items). Fur-
thermore, the Kaiser-Meyer-Olkin measure of sampling adequacy was
examined and indicated similar results; specifically, the KMO value was
0.856, which indicates an excellent sample adequacy.