Page 191 - Hojnik, Jana. 2017. In Persuit of Eco-innovation. Drivers and Consequences of Eco-innovation at Firm Level. Koper: University of Primorska Press
P. 191
Results 191
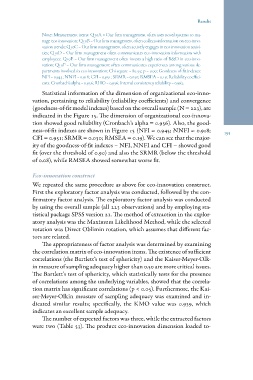
Note: Measurement items: Q10A = Our firm management often uses novel systems to ma-
nage eco-innovation; Q10B = Our firm management often collects information on eco-inno-
vation trends; Q10C = Our firm management often actively engages in eco-innovation activi-
ties; Q10D = Our firm management often communicates eco-innovation information with
employees; Q10E = Our firm management often invests a high ratio of R&D in eco-inno-
vation; Q10F = Our firm management often communicates experiences among various de-
partments involved in eco-innovation; Chi-square = 80.33; p = 0.00; Goodness-of-fit indexes:
NFI = 0.945; NNFI = 0.918; CFI = 0.951; SRMR = 0.030; RMSEA = 0.19; Reliability coeffici-
ents: Cronbach’s alpha = 0.956; RHO = 0.956; Internal consistency reliability = 0.962.
Statistical information of the dimension of organizational eco-inno-
vation, pertaining to reliability (reliability coefficients) and convergence
(goodness-of-fit model indexes) based on the overall sample (N = 223), are
indicated in the Figure 15. The dimension of organizational eco-innova-
tion showed good reliability (Cronbach’s alpha = 0.956). Also, the good-
ness-of-fit indexes are shown in Figure 15 (NFI = 0.945; NNFI = 0.918;
CFI = 0.951; SRMR = 0.030; RMSEA = 0.19). We can see that the major-
ity of the goodness-of-fit indexes – NFI, NNFI and CFI – showed good
fit (over the threshold of 0.90) and also the SRMR (below the threshold
of 0.08), while RMSEA showed somewhat worse fit.
Eco-innovation construct
We repeated the same procedure as above for eco-innovation construct.
First the exploratory factor analysis was conducted, followed by the con-
firmatory factor analysis. The exploratory factor analysis was conducted
by using the overall sample (all 223 observations) and by employing sta-
tistical package SPSS version 21. The method of extraction in the explor-
atory analysis was the Maximum Likelihood Method, while the selected
rotation was Direct Oblimin rotation, which assumes that different fac-
tors are related.
The appropriateness of factor analysis was determined by examining
the correlation matrix of eco-innovation items. The existence of sufficient
correlations (the Bartlett’s test of sphericity) and the Kaiser-Meyer-Olk-
in measure of sampling adequacy higher than 0.50 are more critical issues.
The Bartlett’s test of sphericity, which statistically tests for the presence
of correlations among the underlying variables, showed that the correla-
tion matrix has significant correlations (p < 0.05). Furthermore, the Kai-
ser-Meyer-Olkin measure of sampling adequacy was examined and in-
dicated similar results; specifically, the KMO value was 0.939, which
indicates an excellent sample adequacy.
The number of expected factors was three, while the extracted factors
were two (Table 53). The product eco-innovation dimension loaded to-