Page 187 - Hojnik, Jana. 2017. In Persuit of Eco-innovation. Drivers and Consequences of Eco-innovation at Firm Level. Koper: University of Primorska Press
P. 187
Results
187
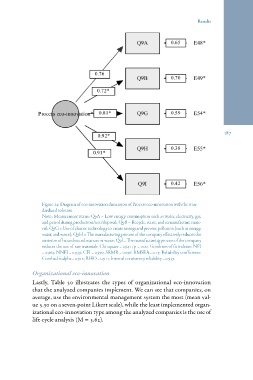
Figure 14: Diagram of eco-innovation dimension of Process eco-innovation with the stan-
dardized solution
Note: Measurement items: Q9A = Low energy consumption such as water, electricity, gas,
and petrol during production/use/disposal; Q9B = Recycle, reuse, and remanufacture mate-
rial; Q9G = Use of cleaner technology to create savings and prevent pollution (such as energy,
water, and waste); Q9H = The manufacturing process of the company effectively reduces the
emission of hazardous substances or waste; Q9I = The manufacturing process of the company
reduces the use of raw materials; Chi-square = 29.41; p = 0.00; Goodness-of-fit indexes: NFI
= 0.964; NNFI = 0.939; CFI = 0.970; SRMR = 0.036; RMSEA= 0.15; Reliability coefficients:
Cronbach’s alpha = 0.912; RHO = 0.911; Internal consistency reliability = 0.937.
Organizational eco-innovation
Lastly, Table 50 illustrates the types of organizational eco-innovation
that the analyzed companies implement. We can see that companies, on
average, use the environmental management system the most (mean val-
ue 5.30 on a seven-point Likert scale), while the least implemented organ-
izational eco-innovation type among the analyzed companies is the use of
life cycle analysis (M = 3.62).
187
Figure 14: Diagram of eco-innovation dimension of Process eco-innovation with the stan-
dardized solution
Note: Measurement items: Q9A = Low energy consumption such as water, electricity, gas,
and petrol during production/use/disposal; Q9B = Recycle, reuse, and remanufacture mate-
rial; Q9G = Use of cleaner technology to create savings and prevent pollution (such as energy,
water, and waste); Q9H = The manufacturing process of the company effectively reduces the
emission of hazardous substances or waste; Q9I = The manufacturing process of the company
reduces the use of raw materials; Chi-square = 29.41; p = 0.00; Goodness-of-fit indexes: NFI
= 0.964; NNFI = 0.939; CFI = 0.970; SRMR = 0.036; RMSEA= 0.15; Reliability coefficients:
Cronbach’s alpha = 0.912; RHO = 0.911; Internal consistency reliability = 0.937.
Organizational eco-innovation
Lastly, Table 50 illustrates the types of organizational eco-innovation
that the analyzed companies implement. We can see that companies, on
average, use the environmental management system the most (mean val-
ue 5.30 on a seven-point Likert scale), while the least implemented organ-
izational eco-innovation type among the analyzed companies is the use of
life cycle analysis (M = 3.62).