Page 186 - Hojnik, Jana. 2017. In Persuit of Eco-innovation. Drivers and Consequences of Eco-innovation at Firm Level. Koper: University of Primorska Press
P. 186
In Pursuit of Eco-innovation
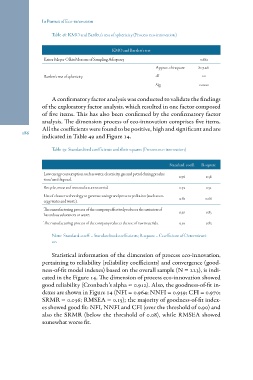
Table 48: KMO and Bartlett’s test of sphericity (Process eco-innovation)
KMO and Bartlett’s test
Kaiser-Meyer-Olkin Measure of Sampling Adequacy 0.861
807.261
Approx. chi-square
10
Bartlett’s test of sphericity df 0.000
Sig.
A confirmatory factor analysis was conducted to validate the findings
of the exploratory factor analysis, which resulted in one factor composed
of five items. This has also been confirmed by the confirmatory factor
analysis. The dimension process of eco-innovation comprises five items.
All the coefficients were found to be positive, high and significant and are
186 indicated in Table 49 and Figure 14.
Table 49: Standardized coefficients and their squares (Process eco-innovation)
Standard. coeff. R-square
0.58
Low energy consumption such as water, electricity, gas and petrol during produc- 0.76 0.52
tion/use/disposal. 0.66
Recycle, reuse and remanufacture material. 0.72 0.85
0.83
Use of cleaner technology to generate savings and prevent pollution (such as en- 0.81
ergy, water and waste).
The manufacturing process of the company effectively reduces the emission of 0.92
hazardous substances or waste.
The manufacturing process of the company reduces the use of raw materials. 0.91
Note: Standard. coeff. = Standardized coefficients; R-square = Coefficient of Determinati-
on.
Statistical information of the dimension of process eco-innovation,
pertaining to reliability (reliability coefficients) and convergence (good-
ness-of-fit model indexes) based on the overall sample (N = 223), is indi-
cated in the Figure 14. The dimension of process eco-innovation showed
good reliability (Cronbach’s alpha = 0.912). Also, the goodness-of-fit in-
dexes are shown in Figure 14 (NFI = 0.964; NNFI = 0.939; CFI = 0.970;
SRMR = 0.036; RMSEA = 0.15); the majority of goodness-of-fit index-
es showed good fit: NFI, NNFI and CFI (over the threshold of 0.90) and
also the SRMR (below the threshold of 0.08), while RMSEA showed
somewhat worse fit.