
Page 129 - Studia Universitatis Hereditati, vol 13(2) (2025)
P. 129
14
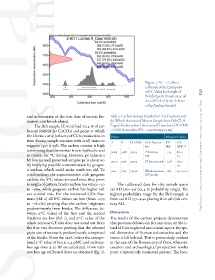
Figure 7: C – 1 Calibrat-
ed Result of the Extrapolat-
ed C Value for Sample of 129
14
Beli (https://c14.arch.ox.ac.uk
/oxcal/OxCal.html; elaborat-
ed by Andreja Sironić)
and information of the true date of mortar for- Table 2: Carbon Isotope Results for CO2 Fractions and
mation, can be calculated. the Whole Amount of Mortar Sample from Beli (Z, A –
The Beli sample (Z-9011) had 70.4 % of car- Zagreb Radiocarbon Laboratory ID numbers, UGAMS
13
bonate content (as CaCO3) and point at which – CAIS ID number, δ C – uncertainty 0.1 ‰)
the kinetic curve (velocity of CO2 production in Name Measured values
time during sample reaction with acid) starts to Z A UGAMS CO2 fraction δ C a C
14
13
stagnate (pc) is 25%. The carbon content is high size (‰) (pMC)
confirming that the mortar is non-hydraulic and 9069 3768 75903 1 fraction, –17.5 80.7 ±
st
14
so reliable for C dating. However, pc value is a 6 % 0.3 The Roman Urbanisation of the Northern Adriatic Island of Cres
bit low (at well preserved samples pc is about 60 9070 3769 75904 2 fraction 19 % –17.8 78.7 ±
nd
%) implying possible contamination by geogen- 0.3
ic carbon, which could make result too old. To 9011 3723 75446 Whole amount –18.0 75.1 ± 0.2
confirm/deny the contamination with geogenic GF (100%)
carbon, the δ C values are used since they point
13
to origin of carbon, binder carbon has values –20 The calibrated date for this sample spans
to –9‰, while geogenic carbon has higher val- cal AD 260–535 (95.4 % probability range). The
ues around 0‰. For the measured CO2 frac- highest probability range for the Beli sample is
tions (tbl. 2) all δ C values are low (from –17.5 from cal AD 337–440 placing it in 4th/5th cen-
13
to –18.0‰) proving that the carbon originates tury AD.
predominantly from binder. The difference be-
tween a C values of the first and the second Discussion
14
fractions are low (tbl. 1), and a C value of the The results of the current projects demonstrate
14
whole amount GF also does not stand out from that previous debates on Roman cities on the is-
the first two fractions proving that the selected land of Cres neglected one crucial aspect: the spa-
grain size of mortar is predominantly comprised tial dimension of Roman urbanisation and the
of the binder. From the a14C values the extrapo- traces it left behind. This is particularly evident
lated a C value of 81.3 ± 0.4 pMC and radiocar- in the case of the Roman city of Osor, where ex-
14
bon age 1660 ± 30 BP are calculated. From radi- cavation and archaeological prospection results
ocarbon age calibrated dates are obtained (fig. 7). paint a historically consistent picture. The loca-