Page 26 - Petelin, Ana. 2020. Ed. Zdravje delovno aktivne populacije / Health of the Working-Age Population. Proceedings. Koper: University of Primorska Press.
P. 26
sons. The International Physical Activity Questionnaire (IPAQ, and an appe-
tite questionnaire at B and during Q. IPAQ data were used to calculate the PA
induced energy expenditure (PAEE).
To evaluate whether Q had different effect on people with different diet
quality, two groups were created: HEI>66 (participants with HEI above mean
value on B, N=25) and HEI<66 (participants with HEI below mean value on B,
N=24). HEI on B and Q were compared between groups.
The data were analysed using IBM SPSS 2.7 (IBM, USA). All variables
were tested for normal distribution (Kolmogorov-Smirnov test); means and
standard deviation were calculated. Student’s paired t-test was used to investi-
gate the effect of Q on the observed parameters.
Results
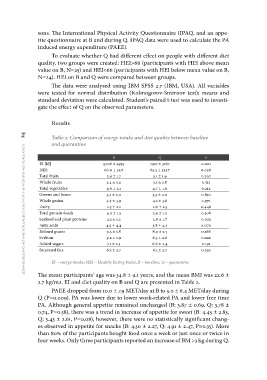
zdravje delovno aktivne populacije | health of the working-age population 24 Table 2: Comparison of energy intake and diet quality between baseline
and quarantine
EI [kJ] B Q P
HEI: 9706 ± 4595 7917 ± 3167 0.001
Total fruits 66.0 ± 14.8 63.3 ± 13.17 0.026
Whole fruits 0.207
Total vegetables 2.9 ± 1.7 3.1 ± 1.9 0.513
Greens and beans 3.4 ± 1.9 3.5 ± 1.8 0.212
Whole grains 4.6 ± 1.2 4.7 ± 1.0 0.850
Dairy 3.3 ± 2.0 3.3 ± 2.0 0.971
Total protein foods 4.5 ± 3.9 4.5 ± 3.8 0.448
Seafood and plant proteins 2.3 ± 2.1 2.6 ± 2.3 0.508
Fatty acids 4.0 ± 1.3 3.9 ± 1.2 0.023
Refined grains 4.3 ± 1.2 3.8 ± 1.7 0.070
Sodium 4.5 ± 4.4 3.8 ± 4.3 0.166
Added sugars 9.3 ± 1.8 8.9 ± 2.5 0.022
Saturated fats 9.2 ± 1.9 8.3 ± 2.8 0.191
7.1 ± 2.5 6.6 ± 2.4 0.259
6.5 ± 3.7 6.1 ± 3.7
EI – energy intake; HEI – Healthy Eating Index; B – baseline; Q – quarantine.
The mean participants’ age was 34.8 ± 9.1 years, and the mean BMI was 22.6 ±
2.7 kg/m2. EI and diet quality on B and Q are presented in Table 2.
PAEE dropped from 10.0 ± 7.9 MET/day at B to 5.0 ± 6.4 MET/day during
Q (P=0.009). PA was lower due to lower work-related PA and lower free time
PA. Although general appetite remained unchanged (B: 3.87 ± 0.69, Q: 3.78 ±
0.74, P=0.58), there was a trend in increase of appetite for sweet (B: 4.43 ± 2.83,
Q: 5.43 ± 2.61, P=0.08), however, there were no statistically significant chang-
es observed in appetite for snacks (B: 4.30 ± 2.27, Q: 4.91 ± 2.47, P=0.35). More
than 80% of the participants bought food once a week or just once or twice in
four weeks. Only three participants reported an increase of BM >3 kg during Q.
tite questionnaire at B and during Q. IPAQ data were used to calculate the PA
induced energy expenditure (PAEE).
To evaluate whether Q had different effect on people with different diet
quality, two groups were created: HEI>66 (participants with HEI above mean
value on B, N=25) and HEI<66 (participants with HEI below mean value on B,
N=24). HEI on B and Q were compared between groups.
The data were analysed using IBM SPSS 2.7 (IBM, USA). All variables
were tested for normal distribution (Kolmogorov-Smirnov test); means and
standard deviation were calculated. Student’s paired t-test was used to investi-
gate the effect of Q on the observed parameters.
Results
zdravje delovno aktivne populacije | health of the working-age population 24 Table 2: Comparison of energy intake and diet quality between baseline
and quarantine
EI [kJ] B Q P
HEI: 9706 ± 4595 7917 ± 3167 0.001
Total fruits 66.0 ± 14.8 63.3 ± 13.17 0.026
Whole fruits 0.207
Total vegetables 2.9 ± 1.7 3.1 ± 1.9 0.513
Greens and beans 3.4 ± 1.9 3.5 ± 1.8 0.212
Whole grains 4.6 ± 1.2 4.7 ± 1.0 0.850
Dairy 3.3 ± 2.0 3.3 ± 2.0 0.971
Total protein foods 4.5 ± 3.9 4.5 ± 3.8 0.448
Seafood and plant proteins 2.3 ± 2.1 2.6 ± 2.3 0.508
Fatty acids 4.0 ± 1.3 3.9 ± 1.2 0.023
Refined grains 4.3 ± 1.2 3.8 ± 1.7 0.070
Sodium 4.5 ± 4.4 3.8 ± 4.3 0.166
Added sugars 9.3 ± 1.8 8.9 ± 2.5 0.022
Saturated fats 9.2 ± 1.9 8.3 ± 2.8 0.191
7.1 ± 2.5 6.6 ± 2.4 0.259
6.5 ± 3.7 6.1 ± 3.7
EI – energy intake; HEI – Healthy Eating Index; B – baseline; Q – quarantine.
The mean participants’ age was 34.8 ± 9.1 years, and the mean BMI was 22.6 ±
2.7 kg/m2. EI and diet quality on B and Q are presented in Table 2.
PAEE dropped from 10.0 ± 7.9 MET/day at B to 5.0 ± 6.4 MET/day during
Q (P=0.009). PA was lower due to lower work-related PA and lower free time
PA. Although general appetite remained unchanged (B: 3.87 ± 0.69, Q: 3.78 ±
0.74, P=0.58), there was a trend in increase of appetite for sweet (B: 4.43 ± 2.83,
Q: 5.43 ± 2.61, P=0.08), however, there were no statistically significant chang-
es observed in appetite for snacks (B: 4.30 ± 2.27, Q: 4.91 ± 2.47, P=0.35). More
than 80% of the participants bought food once a week or just once or twice in
four weeks. Only three participants reported an increase of BM >3 kg during Q.