Page 25 - Petelin, Ana. 2020. Ed. Zdravje delovno aktivne populacije / Health of the Working-Age Population. Proceedings. Koper: University of Primorska Press.
P. 25
changes in diet during Q comparing nutritional data before and during Q.
The aim of this study was to investigate changes in dietary patterns during Q.
Methods
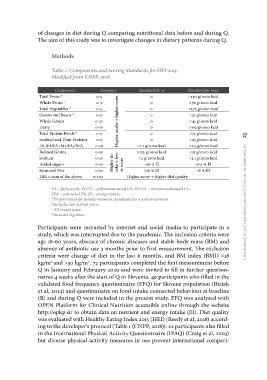
Table 1: Components and Scoring Standards for HEI-2015.
Modified from CNPP, 2018.
Component Scoring a Standard for 0 Standard for max
Total Fruits b 0-5
Whole Fruits c 0-5 0 >140 g/1000 kcal
Total Vegetables d 0-5 Higher in-
Greens and Beans d 0-5 take → low- Higher intake → higher score0 >70 g/1000 kcal
Whole Grains 0-10 er score
Dairy 0-10 0 >176 g/1000 kcal
Total Protein Foods d 0-5 the influence of gut microbiota and probiotics on children health 23
Seafood and Plant Proteins 0-5 0 >32 g/1000 kcal
FA (PUFA+MUFA)/SFA 0-10
Refined Grains 0-10 0 >43 g/1000 kcal
Sodium 0-10
Added sugars 0-10 0 >319 g/1000 kcal
Saturated Fats 0-10
HEI = sum of the above 0-100 0 >71 g/1000 kcal
0 >23 g/1000 kcal
<1.2 g/1000 kcal >2.5 g/1000 kcal
>122 g/1000 kcal <51 g/1000 kcal
>2 g/1000 kcal <1.1 g/1000 kcal
>26 % EI <6.5 % EI
>16 % EI <8 % EI
Higher score → higher diet quality
FA – fatty acids; PUFA – polyunsaturated FA; MUFA – monounsaturated FA;
SFA – saturated FA; EI – energy intake
a Proportional for intakes between standards for 0 and maximum.
b Includes 100 % fruit juice.
c All except juice.
d Includes legumes.
Participants were recruited by internet and social media to participate in a
study, which was interrupted due to the pandemic. The inclusion criteria were
age 18-60 years, absence of chronic diseases and stable body mass (BM) and
absence of antibiotic use 3 months prior to first measurement. The exclusion
criteria were change of diet in the last 6 months, and BM index (BMI) <18
kg/m2 and >30 kg/m2. 72 participants completed the first measurement before
Q in January and February 2020 and were invited to fill in further question-
naires 4 weeks after the start of Q in Slovenia. 49 participants who filled in the
validated food frequency questionnaire (FFQ) for Slovene population (Bizjak
et al, 2014) and questionnaire on food-intake connected behaviour at baseline
(B) and during Q were included in the present study. FFQ was analysed with
OPEN Platform for Clinical Nutrition accessible online through the website
http://opkp.si/ to obtain data on nutrient and energy intake (EI). Diet quality
was evaluated with Healthy Eating Index 2015 (HEI) (Reedy et al, 2018) accord-
ing to the developer’s protocol (Table 1 (CNPP, 2018)). 22 participants also filled
in the International Physical Activity Questionnaire (IPAQ) (Craig et al, 2003)
but diverse physical activity measures in use prevent international compari-
The aim of this study was to investigate changes in dietary patterns during Q.
Methods
Table 1: Components and Scoring Standards for HEI-2015.
Modified from CNPP, 2018.
Component Scoring a Standard for 0 Standard for max
Total Fruits b 0-5
Whole Fruits c 0-5 0 >140 g/1000 kcal
Total Vegetables d 0-5 Higher in-
Greens and Beans d 0-5 take → low- Higher intake → higher score0 >70 g/1000 kcal
Whole Grains 0-10 er score
Dairy 0-10 0 >176 g/1000 kcal
Total Protein Foods d 0-5 the influence of gut microbiota and probiotics on children health 23
Seafood and Plant Proteins 0-5 0 >32 g/1000 kcal
FA (PUFA+MUFA)/SFA 0-10
Refined Grains 0-10 0 >43 g/1000 kcal
Sodium 0-10
Added sugars 0-10 0 >319 g/1000 kcal
Saturated Fats 0-10
HEI = sum of the above 0-100 0 >71 g/1000 kcal
0 >23 g/1000 kcal
<1.2 g/1000 kcal >2.5 g/1000 kcal
>122 g/1000 kcal <51 g/1000 kcal
>2 g/1000 kcal <1.1 g/1000 kcal
>26 % EI <6.5 % EI
>16 % EI <8 % EI
Higher score → higher diet quality
FA – fatty acids; PUFA – polyunsaturated FA; MUFA – monounsaturated FA;
SFA – saturated FA; EI – energy intake
a Proportional for intakes between standards for 0 and maximum.
b Includes 100 % fruit juice.
c All except juice.
d Includes legumes.
Participants were recruited by internet and social media to participate in a
study, which was interrupted due to the pandemic. The inclusion criteria were
age 18-60 years, absence of chronic diseases and stable body mass (BM) and
absence of antibiotic use 3 months prior to first measurement. The exclusion
criteria were change of diet in the last 6 months, and BM index (BMI) <18
kg/m2 and >30 kg/m2. 72 participants completed the first measurement before
Q in January and February 2020 and were invited to fill in further question-
naires 4 weeks after the start of Q in Slovenia. 49 participants who filled in the
validated food frequency questionnaire (FFQ) for Slovene population (Bizjak
et al, 2014) and questionnaire on food-intake connected behaviour at baseline
(B) and during Q were included in the present study. FFQ was analysed with
OPEN Platform for Clinical Nutrition accessible online through the website
http://opkp.si/ to obtain data on nutrient and energy intake (EI). Diet quality
was evaluated with Healthy Eating Index 2015 (HEI) (Reedy et al, 2018) accord-
ing to the developer’s protocol (Table 1 (CNPP, 2018)). 22 participants also filled
in the International Physical Activity Questionnaire (IPAQ) (Craig et al, 2003)
but diverse physical activity measures in use prevent international compari-