Page 158 - Hojnik, Jana. 2017. In Persuit of Eco-innovation. Drivers and Consequences of Eco-innovation at Firm Level. Koper: University of Primorska Press
P. 158
In Pursuit of Eco-innovation
158
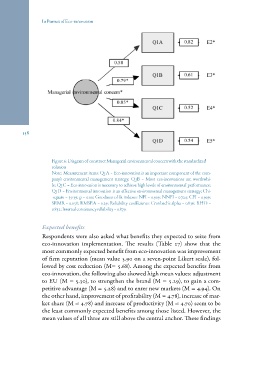
Figure 6: Diagram of construct Managerial environmental concern with the standardized
solution
Note: Measurement items: Q1A = Eco-innovation is an important component of the com-
pany’s environmental management strategy; Q1B = Most eco-innovations are worthwhi-
le; Q1C = Eco-innovation is necessary to achieve high levels of environmental performance;
Q1D = Environmental innovation is an effective environmental management strategy; Chi-
-square = 39.39; p = 0.00; Goodness-of-fit indexes: NFI = 0.909; NNFI = 0.724; CFI = 0.909;
SRMR = 0.058; RMSEA = 0.29; Reliability coefficients: Cronbach’s alpha = 0.836; RHO =
0.832; Internal consistency reliability = 0.879.
Expected benefits
Respondents were also asked what benefits they expected to seize from
eco-innovation implementation. The results (Table 27) show that the
most commonly expected benefit from eco-innovation was improvement
of firm reputation (mean value 5.90 on a seven-point Likert scale), fol-
lowed by cost reduction (M= 5.68). Among the expected benefits from
eco-innovation, the following also showed high mean values: adjustment
to EU (M = 5.30), to strengthen the brand (M = 5.29), to gain a com-
petitive advantage (M = 5.28) and to enter new markets (M = 4.94). On
the other hand, improvement of profitability (M = 4.78), increase of mar-
ket share (M = 4.78) and increase of productivity (M = 4.70) seem to be
the least commonly expected benefits among those listed. However, the
mean values of all three are still above the central anchor. These findings
158
Figure 6: Diagram of construct Managerial environmental concern with the standardized
solution
Note: Measurement items: Q1A = Eco-innovation is an important component of the com-
pany’s environmental management strategy; Q1B = Most eco-innovations are worthwhi-
le; Q1C = Eco-innovation is necessary to achieve high levels of environmental performance;
Q1D = Environmental innovation is an effective environmental management strategy; Chi-
-square = 39.39; p = 0.00; Goodness-of-fit indexes: NFI = 0.909; NNFI = 0.724; CFI = 0.909;
SRMR = 0.058; RMSEA = 0.29; Reliability coefficients: Cronbach’s alpha = 0.836; RHO =
0.832; Internal consistency reliability = 0.879.
Expected benefits
Respondents were also asked what benefits they expected to seize from
eco-innovation implementation. The results (Table 27) show that the
most commonly expected benefit from eco-innovation was improvement
of firm reputation (mean value 5.90 on a seven-point Likert scale), fol-
lowed by cost reduction (M= 5.68). Among the expected benefits from
eco-innovation, the following also showed high mean values: adjustment
to EU (M = 5.30), to strengthen the brand (M = 5.29), to gain a com-
petitive advantage (M = 5.28) and to enter new markets (M = 4.94). On
the other hand, improvement of profitability (M = 4.78), increase of mar-
ket share (M = 4.78) and increase of productivity (M = 4.70) seem to be
the least commonly expected benefits among those listed. However, the
mean values of all three are still above the central anchor. These findings