Page 159 - Hojnik, Jana. 2017. In Persuit of Eco-innovation. Drivers and Consequences of Eco-innovation at Firm Level. Koper: University of Primorska Press
P. 159
Results
lead us to the conclusion that Slovenian companies are aware of the po-
tential of eco-innovation for their companies.
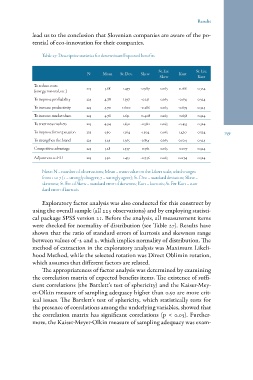
Table 27: Descriptive statistics for determinant Expected benefits
N Mean St. Dev. Skew St. Err. Kurt St. Err.
Skew Kurt
To reduce costs 223 5.68 1.459 -0.987 0.163 0.166 0.324 159
(energy, material, etc.)
To improve profitability 223 4.78 1.597 -0.251 0.163 -0.635 0.324
To increase productivity 223 4.70 1.600 -0.286 0.163 -0.673 0.324
To increase market share 223 4.78 1.631 -0.408 0.163 -0.658 0.324
To enter new markets 223 4.94 1.650 -0.580 0.163 -0.453 0.324
To improve firm reputation 223 5.90 1.264 -1.304 0.163 1.420 0.324
To strengthen the brand 223 5.29 1.565 -0.834 0.163 0.104 0.324
Competitive advantage 223 5.28 1.537 -0.761 0.163 -0.107 0.324
Adjustment to EU 223 5.30 1.431 -0.736 0.163 0.074 0.324
Note: N = number of observations; Mean = mean value on the Likert scale, which ranges
from 1 to 7 (1 = strongly disagree, 7 = strongly agree); St. Dev. = standard deviation; Skew =
skewness; St. Err. of Skew = standard error of skewness; Kurt = kurtosis; St. Err. Kurt = stan-
dard error of kurtosis.
Exploratory factor analysis was also conducted for this construct by
using the overall sample (all 223 observations) and by employing statisti-
cal package SPSS version 21. Before the analysis, all measurement items
were checked for normality of distribution (see Table 27). Results have
shown that the ratio of standard errors of kurtosis and skewness range
between values of -2 and 2, which implies normality of distribution. The
method of extraction in the exploratory analysis was Maximum Likeli-
hood Method, while the selected rotation was Direct Oblimin rotation,
which assumes that different factors are related.
The appropriateness of factor analysis was determined by examining
the correlation matrix of expected benefits items. The existence of suffi-
cient correlations (the Bartlett’s test of sphericity) and the Kaiser-Mey-
er-Olkin measure of sampling adequacy higher than 0.50 are more crit-
ical issues. The Bartlett’s test of sphericity, which statistically tests for
the presence of correlations among the underlying variables, showed that
the correlation matrix has significant correlations (p < 0.05). Further-
more, the Kaiser-Meyer-Olkin measure of sampling adequacy was exam-
lead us to the conclusion that Slovenian companies are aware of the po-
tential of eco-innovation for their companies.
Table 27: Descriptive statistics for determinant Expected benefits
N Mean St. Dev. Skew St. Err. Kurt St. Err.
Skew Kurt
To reduce costs 223 5.68 1.459 -0.987 0.163 0.166 0.324 159
(energy, material, etc.)
To improve profitability 223 4.78 1.597 -0.251 0.163 -0.635 0.324
To increase productivity 223 4.70 1.600 -0.286 0.163 -0.673 0.324
To increase market share 223 4.78 1.631 -0.408 0.163 -0.658 0.324
To enter new markets 223 4.94 1.650 -0.580 0.163 -0.453 0.324
To improve firm reputation 223 5.90 1.264 -1.304 0.163 1.420 0.324
To strengthen the brand 223 5.29 1.565 -0.834 0.163 0.104 0.324
Competitive advantage 223 5.28 1.537 -0.761 0.163 -0.107 0.324
Adjustment to EU 223 5.30 1.431 -0.736 0.163 0.074 0.324
Note: N = number of observations; Mean = mean value on the Likert scale, which ranges
from 1 to 7 (1 = strongly disagree, 7 = strongly agree); St. Dev. = standard deviation; Skew =
skewness; St. Err. of Skew = standard error of skewness; Kurt = kurtosis; St. Err. Kurt = stan-
dard error of kurtosis.
Exploratory factor analysis was also conducted for this construct by
using the overall sample (all 223 observations) and by employing statisti-
cal package SPSS version 21. Before the analysis, all measurement items
were checked for normality of distribution (see Table 27). Results have
shown that the ratio of standard errors of kurtosis and skewness range
between values of -2 and 2, which implies normality of distribution. The
method of extraction in the exploratory analysis was Maximum Likeli-
hood Method, while the selected rotation was Direct Oblimin rotation,
which assumes that different factors are related.
The appropriateness of factor analysis was determined by examining
the correlation matrix of expected benefits items. The existence of suffi-
cient correlations (the Bartlett’s test of sphericity) and the Kaiser-Mey-
er-Olkin measure of sampling adequacy higher than 0.50 are more crit-
ical issues. The Bartlett’s test of sphericity, which statistically tests for
the presence of correlations among the underlying variables, showed that
the correlation matrix has significant correlations (p < 0.05). Further-
more, the Kaiser-Meyer-Olkin measure of sampling adequacy was exam-