Page 33 - Management 16.2
P. 33
Philipp Asen, Vito Bobek, and Tatjana Horvat | The Efficiency of Ports and Airports
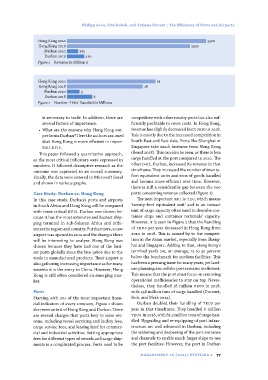
Hong Kong 2010 3300
Hong Kong 2018 2920
Durban 2010 265
Durban 2018 410
Figure 1 Revenue in Million €
Hong Kong 2010 21
Hong Kong 2018 18
Durban 2010 3
Durban 2018 6
Figure 2 Number teus Handled in Millions
is necessary to trade. In addition, there are competitive with other nearby ports but also suf-
several factors of importance. ficiently profitable to cover costs. In Hong Kong,
revenue has slightly decreased from 2010 to 2018.
• What are the reasons why Hong Kong out- This is mostly due to the increased competition in
performs Durban? Here the authors assumed South-East and East Asia. Ports like Shanghai or
that Hong Kong is more efficient in impor- Singapore take much business from Hong Kong
tant kpis. (Beard 2018). This can also be seen, as there is less
cargo handled at the port compared to 2010. The
This paper followed a quantitative approach, other port, Durban, increased its revenue in that
as the most critical indicators were expressed in timeframe. They increased the number of twenty-
numbers. It followed descriptive research as the foot equivalent units and tons of goods handled
outcome was expressed in an overall summary. and became more efficient over time. However,
Finally, the data were entered in Microsoft Excel there is still a considerable gap between the two
and shown in various graphs. ports concerning revenue collected (figure 1).
Case Study: Durban vs. Hong Kong The next important kpi is teu, which means
In this case study, Durban’s ports and airports ‘twenty-foot equivalent unit’ and is an inexact
in South Africa and Hong Kong will be compared unit of cargo capacity often used to describe con-
with some critical kpis. Durban was chosen be- tainer ships and container terminals’ capacity.
cause it has the most extensive and busiest ship- However, it is seen in Figure 2 that the handling
ping terminal in sub-Saharan Africa and influ- of teus per year decreased in Hong Kong from
ences the region and country. Furthermore, a new 2010 to 2018. This is caused by to the competi-
airport was opened in 2010 and the changes there tion in the Asian market, especially from Shang-
will be interesting to analyse. Hong Kong was hai and Singapore. Adding to that, Hong Kong’s
chosen because they have had one of the busi- terminal yards are, on average, 25 to 30 percent
est ports globally since the late 1980s due to the below the benchmark for modern facilities. This
trade in manufactured products. Their airport is has been a pressing issue for many years, yet land-
also gathering increasing importance as for many use planning around the port remains inefficient.
tourists it is the entry to China. However, Hong This means that the port must focus on removing
Kong is still often considered an emerging mar- operational inefficiencies to stay on top. Never-
ket. theless, they handled 18 million teus in 2018,
with 258 million tons of cargo handled (Ducruet,
Ports Itoh, and Merk 2014).
Starting with one of the most important finan-
cial indicators of every company, Figure 1 shows Durban doubled their handling of teus per
the revenue in € of Hong Kong and Durban. There year in that timeframe. They handled 6 million
are several charges that ports levy to raise rev- teus in 2018, with 81.2 million tons of cargo han-
enue, including vessel servicing and facility fees, dled. Upgrading and re-equipping of port infras-
cargo service fees, and leasing land for commer- tructure are well advanced in Durban, including
cial and industrial activities. Setting appropriate the widening and deepening of the port entrance
fees for different types of vessels and cargo ship- and channels to enable much larger ships to use
ments is a complicated process. Ports need to be the port facilities. However, the port in Durban
management 16 (2021) številka 2 77