Page 183 - Hojnik, Jana. 2017. In Persuit of Eco-innovation. Drivers and Consequences of Eco-innovation at Firm Level. Koper: University of Primorska Press
P. 183
Results
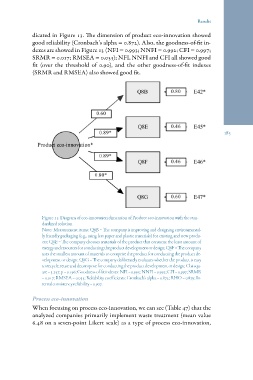
dicated in Figure 13. The dimension of product eco-innovation showed
good reliability (Cronbach’s alpha = 0.872). Also, the goodness-of-fit in-
dexes are showed in Figure 13 (NFI = 0.993; NNFI = 0.992; CFI = 0.997;
SRMR = 0.017; RMSEA = 0.053); NFI, NNFI and CFI all showed good
fit (over the threshold of 0.90), and the other goodness-of-fit indexes
(SRMR and RMSEA) also showed good fit.
183
Figure 13: Diagram of eco-innovation dimension of Product eco-innovation with the stan-
dardized solution
Note: Measurement items: Q8B = The company is improving and designing environmental-
ly friendly packaging (e.g., using less paper and plastic materials) for existing and new produ-
cts; Q8E = The company chooses materials of the product that consume the least amount of
energy and resources for conducting the product development or design; Q8F = The company
uses the smallest amount of materials to comprise the product for conducting the product de-
velopment or design; Q8G = The company deliberately evaluates whether the product is easy
to recycle, reuse and decompose for conducting the product development or design; Chi-squ-
are = 3.257; p = 0.196; Goodness-of-fit indexes: NFI = 0.993; NNFI = 0.992; CFI = 0.997; SRMR
= 0.017; RMSEA = 0.053; Reliability coefficients: Cronbach’s alpha = 0.872; RHO = 0.879; In-
ternal consistency reliability = 0.907.
Process eco-innovation
When focusing on process eco-innovation, we can see (Table 47) that the
analyzed companies primarily implement waste treatment (mean value
6.48 on a seven-point Likert scale) as a type of process eco-innovation,