Page 182 - Hojnik, Jana. 2017. In Persuit of Eco-innovation. Drivers and Consequences of Eco-innovation at Firm Level. Koper: University of Primorska Press
P. 182
Pursuit of Eco-innovation
and no further items were excluded; all four items were retained to meas-
ure product eco-innovation. Additionally, with four items, we are able to
explain 64.316% of variance (a higher percentage than for the five items
tested above); lastly, one factor is extracted.
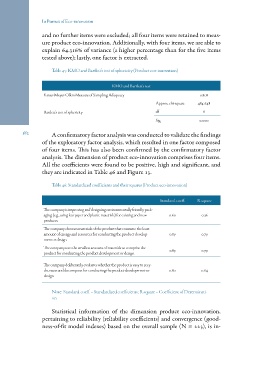
Table 45: KMO and Bartlett’s test of sphericity (Product eco-innovation)
KMO and Bartlett’s test
Kaiser-Meyer-Olkin Measure of Sampling Adequacy 0.808
484.648
Approx. chi-square
6
Bartlett’s test of sphericity df 0.000
Sig.
182 A confirmatory factor analysis was conducted to validate the findings
of the exploratory factor analysis, which resulted in one factor composed
of four items. This has also been confirmed by the confirmatory factor
analysis. The dimension of product eco-innovation comprises four items.
All the coefficients were found to be positive, high and significant, and
they are indicated in Table 46 and Figure 13.
Table 46: Standardized coefficients and their squares (Product eco-innovation)
The company is improving and designing environmentally friendly pack- Standard. coeff. R-square
aging (e.g., using less paper and plastic materials) for existing and new 0.60 0.36
products. 0.79
0.89 0.79
The company chooses materials of the product that consume the least 0.89 0.64
amount of energy and resources for conducting the product develop-
ment or design.
The company uses the smallest amount of materials to comprise the
product for conducting the product development or design.
The company deliberately evaluates whether the product is easy to recy- 0.80
cle, reuse and decompose for conducting the product development or
design.
Note: Standard. coeff. = Standardized coefficients; R-square = Coefficient of Determinati-
on.
Statistical information of the dimension product eco-innovation,
pertaining to reliability (reliability coefficients) and convergence (good-
ness-of-fit model indexes) based on the overall sample (N = 223), is in-
and no further items were excluded; all four items were retained to meas-
ure product eco-innovation. Additionally, with four items, we are able to
explain 64.316% of variance (a higher percentage than for the five items
tested above); lastly, one factor is extracted.
Table 45: KMO and Bartlett’s test of sphericity (Product eco-innovation)
KMO and Bartlett’s test
Kaiser-Meyer-Olkin Measure of Sampling Adequacy 0.808
484.648
Approx. chi-square
6
Bartlett’s test of sphericity df 0.000
Sig.
182 A confirmatory factor analysis was conducted to validate the findings
of the exploratory factor analysis, which resulted in one factor composed
of four items. This has also been confirmed by the confirmatory factor
analysis. The dimension of product eco-innovation comprises four items.
All the coefficients were found to be positive, high and significant, and
they are indicated in Table 46 and Figure 13.
Table 46: Standardized coefficients and their squares (Product eco-innovation)
The company is improving and designing environmentally friendly pack- Standard. coeff. R-square
aging (e.g., using less paper and plastic materials) for existing and new 0.60 0.36
products. 0.79
0.89 0.79
The company chooses materials of the product that consume the least 0.89 0.64
amount of energy and resources for conducting the product develop-
ment or design.
The company uses the smallest amount of materials to comprise the
product for conducting the product development or design.
The company deliberately evaluates whether the product is easy to recy- 0.80
cle, reuse and decompose for conducting the product development or
design.
Note: Standard. coeff. = Standardized coefficients; R-square = Coefficient of Determinati-
on.
Statistical information of the dimension product eco-innovation,
pertaining to reliability (reliability coefficients) and convergence (good-
ness-of-fit model indexes) based on the overall sample (N = 223), is in-