Page 184 - Hojnik, Jana. 2017. In Persuit of Eco-innovation. Drivers and Consequences of Eco-innovation at Firm Level. Koper: University of Primorska Press
P. 184
In Pursuit of Eco-innovation
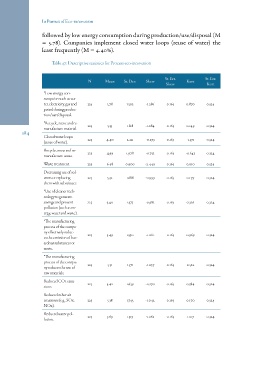
followed by low energy consumption during production/use/disposal (M
= 5.78). Companies implement closed water loops (reuse of water) the
least frequently (M = 4.40%).
Table 47: Descriptive statistics for Process eco-innovation
N Mean St. Dev. Skew St. Err. Kurt St. Err.
Skew Kurt
*Low energy con-
sumption such as wa-
ter, electricity, gas and 223 5.78 1.502 -1.286 0.163 0.870 0.324
petrol during produc-
tion/use/disposal.
184 *Recycle, reuse and re- 223 5.33 1.818 -1.084 0.163 0.149 0.324
manufacture material. 223 4.40 2.211 -0.273 0.163 -1.371 0.324
Closed water loops
(reuse of water).
Recycle, reuse and re- 223 4.99 1.978 -0.752 0.163 -0.643 0.324
manufacture waste.
Waste treatment. 223 6.48 0.900 -2.449 0.163 0.010 0.324
Decreasing use of sol- 223 5.32 1.688 -0.999 0.163 0.179 0.324
vents or replacing
them with substitutes.
*Use of cleaner tech-
nology to generate
savings and prevent 223 5.40 1.573 -0.982 0.163 0.326 0.324
pollution (such as en-
ergy, water and waste).
*The manufacturing
process of the compa-
ny effectively reduc- 223 5.49 1.530 -1.160 0.163 0.969 0.324
es the emission of haz-
ardous substances or
waste.
*The manufacturing
process of the compa- 223 5.31 1.571 -1.037 0.163 0.522 0.324
ny reduces the use of
raw materials.
Reduced CO2 emis- 223 5.42 1.639 -1.070 0.163 0.384 0.324
sions.
Reduced other air 223 5.38 1.743 -1.042 0.163 0.170 0.324
emissions (e.g., SOx,
NOx).
Reduced water pol- 223 5.69 1.519 -1.262 0.163 1.107 0.324
lution.